Vodafone 2015 Annual Report Download - page 206
Download and view the complete annual report
Please find page 206 of the 2015 Vodafone annual report below. You can navigate through the pages in the report by either clicking on the pages listed below, or by using the keyword search tool below to find specific information within the annual report.-
 1
1 -
2
-
3
-
4
-
5
-
6
-
7
-
8
-
9
-
10
-
11
-
12
-
13
-
14
-
15
-
16
-
17
-
18
-
19
-
20
-
21
-
22
-
23
-
24
-
25
-
26
-
27
-
28
-
29
-
30
-
31
-
32
-
33
-
34
-
35
-
36
-
37
-
38
-
39
-
40
-
41
-
42
-
43
-
44
-
45
-
46
-
47
-
48
-
49
-
50
-
51
-
52
-
53
-
54
-
55
-
56
-
57
-
58
-
59
-
60
-
61
-
62
-
63
-
64
-
65
-
66
-
67
-
68
-
69
-
70
-
71
-
72
-
73
-
74
-
75
-
76
-
77
-
78
-
79
-
80
-
81
-
82
-
83
-
84
-
85
-
86
-
87
-
88
-
89
-
90
-
91
-
92
-
93
-
94
-
95
-
96
-
97
-
98
-
99
-
100
-
101
-
102
-
103
-
104
-
105
-
106
-
107
-
108
-
109
-
110
-
111
-
112
-
113
-
114
-
115
-
116
-
117
-
118
-
119
-
120
-
121
-
122
-
123
-
124
-
125
-
126
-
127
-
128
-
129
-
130
-
131
-
132
-
133
-
134
-
135
-
136
-
137
-
138
-
139
-
140
-
141
-
142
-
143
-
144
-
145
-
146
-
147
-
148
-
149
-
150
-
151
-
152
-
153
-
154
-
155
-
156
-
157
-
158
-
159
-
160
-
161
-
162
-
163
-
164
-
165
-
166
-
167
-
168
-
169
-
170
-
171
-
172
-
173
-
174
-
175
-
176
-
177
-
178
-
179
-
180
-
181
-
182
-
183
-
184
-
185
-
186
-
187
-
188
-
189
-
190
-
191
-
192
-
193
-
194
-
195
-
 196
196 -
 197
197 -
 198
198 -
 199
199 -
 200
200 -
 201
201 -
 202
202 -
 203
203 -
 204
204 -
 205
205 -
 206
206 -
 207
207 -
 208
208 -
 209
209 -
 210
210 -
 211
211 -
 212
212 -
 213
213 -
 214
214 -
 215
215 -
 216
216
 |
 |

Period
Organic
change
%
Other
activity1
pps
Foreign
exchange
pps
Reported
change
%
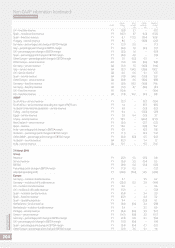
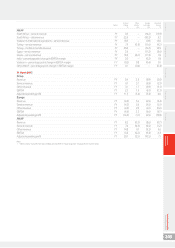
UK – xed line revenue FY (5.8) 5.1 –(0.7)
Spain – mobile service revenue FY (12.7) 5.7 (6.3) (13.3)
Spain – xed line revenue FY 8.7 172. 5 (19.4) 161. 8
Hungary – service revenue FY 8.6 –(10.8) (2.2)
Germany – percentage point change in EBITDA margin FY (3.1) 2.0 –(1.1)
Italy – percentage point change in EBITDA margin FY (2.6) 1.0 (0.1) (1.7)
UK – percentage point change in EBITDA margin FY (2.5) 1.6 –(0.9)
Spain – percentage point change in EBITDA margin FY (5.0) 4.0 –(1.0)
Other Europe – percentage point change in EBITDA margin FY 0 .1 (0.2) 0 .1 –
Other Europe – service revenue Q3 (1.0) 0.8 (6.6) (6.8)
Germany – service revenue Q4 (3.1) 1.5 (10.0) (11.6)
Italy – service revenue Q4 (3.7) 134. 5 (28.6) 102.2
UK – service revenue Q4 0.6 5.6 0.1 6.3
Spain – service revenue Q4 (7.8) 34.6 (13.0) 13. 8
Other Europe – service revenue Q4 (0.8) 2.6 (10.6) (8.8)
Germany – xed line revenue H1 (2.9) 93.3 (10.8) 79.6
Germany – xed line revenue H2 (1.2) 6.7 (8.6) (3.1)
UK – xed line revenue H1 (10.4) – – (10.4)
UK – xed line revenue H2 (1.3) 10.2 (0.1) 8.8
AMAP
South Africa – service revenue FY (2.7) –(9.7) (12.4)
South Africa – service revenue excluding the impact of MTR cuts FY 1.4 –(9.7) (8.3)
Vodacom’s international operations – service revenue FY 4.8 –(5.3) (0.5)
Turkey – service revenue FY 9.4 –(13.3) (3.9)
Egypt – service revenue FY 2.8 6.4 (5.5) 3.7
Ghana – service revenue FY 18.9 –(40.2) (21.3)
New Zealand – service revenue FY (2.6) –(2.7) (5.3)
Qatar – revenue FY 16.0 –(0.8) 15.2
India – percentage point change in EBITDA margin FY 0.9 –(0.1) 0.8
Vodacom – percentage point change in EBITDA margin FY (1.1) –(0.1) (1.2)
Other AMAP – percentage point change in EBITDA margin FY (0.4) (0.3) 0.5 (0.2)
Vodacom – service revenue Q4 (0.2) –1.4 1.2
India – service revenue Q4 12.1 –9.3 21.4
31 March 2014
Group
Revenue FY (2.2) 5.5 (2.5) 0.8
Service revenue FY (2.6) 5.5 (2.4) 0.5
EBITDA FY (6.9) 6.0 (2.4) (3.3)
Percentage point change in EBITDA margin FY (1.5) 0.3 –(1.2)
Adjusted operating prot FY (22.0) (15.4) 14. 5 (22.9)
Europe
Germany – mobile in-bundle revenue FY 2.7 -3.5 6.2
Germany – mobile out-of-bundle revenue FY (22.6) 0.3 2.9 (19.4)
UK – mobile in-bundle revenue FY 0.6 – – 0.6
UK – mobile out-of-bundle revenue FY (7.2) – – (7.2)
Spain – mobile in-bundle revenue FY (0.4) –3.4 3.0
Spain – xed line revenue FY (0.2) –3.4 3.2
Spain – operating expenses FY 9.4 –(3.3) 6 .1
Netherlands – service revenue FY (5.6) (0.6) 3.4 (2.8)
Netherlands – mobile in-bundle revenue FY 3.4 –3.5 6.9
Portugal – service revenue FY (8.4) (0.6) 3.3 (5.7)
Greece – service revenue FY (14.1) (0.8) 3.2 (11.7)
Germany – percentage point change in EBITDA margin FY (4.3) 0.8 0 .1 (3.4)
UK – percentage point change in EBITDA margin FY (1.0) (0.4) –(1.4)
Spain – percentage point change in EBITDA margin FY (3.4) (0.4) 0 .1 (3.7)
Other Europe – percentage point change in EBITDA margin FY (2.1) 3.6 0 .1 1.6
Vodafone Group Plc
Annual Report 2015
204
Non-GAAP information (continued)
Unaudited information