Vodafone 2015 Annual Report Download - page 49
Download and view the complete annual report
Please find page 49 of the 2015 Vodafone annual report below. You can navigate through the pages in the report by either clicking on the pages listed below, or by using the keyword search tool below to find specific information within the annual report.-
 1
1 -
2
-
3
-
4
-
5
-
6
-
7
-
8
-
9
-
10
-
11
-
12
-
13
-
14
-
15
-
16
-
17
-
18
-
19
-
20
-
21
-
22
-
23
-
24
-
25
-
26
-
27
-
28
-
29
-
30
-
31
-
32
-
33
-
34
-
35
-
36
-
37
-
38
-
 39
39 -
 40
40 -
 41
41 -
 42
42 -
 43
43 -
 44
44 -
 45
45 -
 46
46 -
 47
47 -
 48
48 -
 49
49 -
 50
50 -
 51
51 -
 52
52 -
 53
53 -
 54
54 -
 55
55 -
 56
56 -
 57
57 -
 58
58 -
 59
59 -
60
-
61
-
62
-
63
-
64
-
65
-
66
-
67
-
68
-
69
-
70
-
71
-
72
-
73
-
74
-
75
-
76
-
77
-
78
-
79
-
80
-
81
-
82
-
83
-
84
-
85
-
86
-
87
-
88
-
89
-
90
-
91
-
92
-
93
-
94
-
95
-
96
-
97
-
98
-
99
-
100
-
101
-
102
-
103
-
104
-
105
-
106
-
107
-
108
-
109
-
110
-
111
-
112
-
113
-
114
-
115
-
116
-
117
-
118
-
119
-
120
-
121
-
122
-
123
-
124
-
125
-
126
-
127
-
128
-
129
-
130
-
131
-
132
-
133
-
134
-
135
-
136
-
137
-
138
-
139
-
140
-
141
-
142
-
143
-
144
-
145
-
146
-
147
-
148
-
149
-
150
-
151
-
152
-
153
-
154
-
155
-
156
-
157
-
158
-
159
-
160
-
161
-
162
-
163
-
164
-
165
-
166
-
167
-
168
-
169
-
170
-
171
-
172
-
173
-
174
-
175
-
176
-
177
-
178
-
179
-
180
-
181
-
182
-
183
-
184
-
185
-
186
-
187
-
188
-
189
-
190
-
191
-
192
-
193
-
194
-
195
-
196
-
197
-
198
-
199
-
200
-
201
-
202
-
203
-
204
-
205
-
206
-
207
-
208
-
209
-
210
-
211
-
212
-
213
-
214
-
215
-
216
 |
 |
Overview Strategy review Performance Governance Financials Additional information Vodafone Group Plc
Annual Report 2015
47
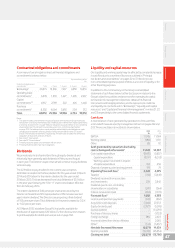
Contractual obligations and commitments
A summary of our principal contractual nancial obligations and
commitments is shown below.
Payments due by period
£m
Contractual obligations and
commitments1Total < 1 year 1–3 years 3–5 years >5 years
Borrowings2 40,373 13,366 7, 297 4,859 14,851
Operating lease
commitments3 6,378 1,339 1,627 1,205 2,207
Capital
commitments3,4 4,957 2,769 322 426 1,440
Purchase
commitments5 8,302 4,064 3,692 234 312
Total 60,010 21,538 12,938 6,724 18,810
Notes:
1 This table includes commitments in respect of options over interests in Group businesses
held by non-controlling shareholders (see “Potential cash outows from option agreements
and similar arrangements” on page 150) and obligations to pay dividends to non-controlling
shareholders (see “Dividends from associates and to non-controlling shareholders”
on page 151). The table excludes current and deferred tax liabilities and obligations under
post employment benet schemes, details of which are provided in notes 6 “Taxation”
and 26 “Post employment benets” respectively. The table also excludes the contractual
obligations of associates and joint ventures.
2 See note 21 “Borrowings”.
3 See note 29 “Commitments”.
4 Primarily related to spectrum and network infrastructure.
5 Primarily related to device purchase obligations.
Dividends
We provide returns to shareholders through equity dividends and
historically have generally paid dividends in February and August
in each year. The Directors expect that we will continue to pay dividends
semi-annually.
The £2.9 billion equity dividend in the current year comprises
£2.0 billion in relation to the nal dividend for the year ended 31 March
2014 and £0.9 billion for the interim dividend for the year ended
31 March 2015. This has decreased from total dividends of £5.1 billion
in the prior year following the “6 for 11” share consolidation effective
from 24 February 2014.
The interim dividend of 3.60 pence per share announced by the
Directors in November 2014 represented an 2.0% increase over last
year’s interim dividend. The Directors are proposing a nal dividend
of 7.62 pence per share. Total dividends for the year increased by 2.0 %
to 11.22 pence per share.
At 31 March 2015, Vodafone Group Plc had prots available for
distribution of approximately £20 billion. Further disclosures in relation
to prots available for distribution are set out on page 184.
Liquidity and capital resources
Our liquidity and working capital may be affected by a material decrease
in cash ow due to a number of factors as outlined in “Principal
risk factors and uncertainties” on pages 32 to 37. We do not use
non-consolidated special purpose entities as a source of liquidity or for
other nancing purposes.
In addition to the commentary on the Group’s consolidated
statement of cash ows below, further disclosure in relation to the
Group’s objectives, policies and processes for managing its capital;
its nancial risk management objectives; details of its nancial
instruments and hedging activities; and its exposures to credit risk
and liquidity risk can be found in “Borrowings”, “Liquidity and capital
resources” and “Capital and nancial risk management” in notes 21, 22
and 23 respectively to the consolidated nancial statements.
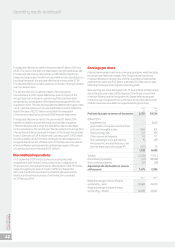
Cash ows
A reconciliation of cash generated by operations to free cash ow,
a non-GAAP measure used by management shown on pages 202 and
203. The reconciliation to net debt is shown below.
2015
£m
2014
£m
EBITDA 11, 915 11, 0 8 4
Working capital (883) 1,181
Other 88 92
Cash generated by operations (excluding
restructuring and other costs)111,120 12,357
Cash capital expenditure (8,435) (5,857)
Capital expenditure (9,197) (6,313)
Working capital movement in respect
of capital expenditure 762 456
Disposal of property, plant and equipment 178 79
Operating free cash ow12,863 6,579
Taxation (758) (3,449)
Dividends received from associates
andinvestments 224 2,842
Dividends paid to non-controlling
shareholders insubsidiaries (247) (264)
Interest received and paid (994) (1,315)
Free cash ow11,088 4,393
Licence and spectrum payments (443) (862)
Acquisitions and disposals (7,040) 27, 372
Equity dividends paid (2,927) (5,076)
Special dividend –(14,291)
Purchase of treasury shares –(1,033)
Foreign exchange 895 2,423
Income dividend from Verizon Wireless –2,065
Other2(144) (3,337)
Net debt (increase)/decrease (8,571) 11,654
Opening net debt (13,700) (25,354)
Closing net debt (22,271) (13,700)