Vodafone 2015 Annual Report Download - page 107
Download and view the complete annual report
Please find page 107 of the 2015 Vodafone annual report below. You can navigate through the pages in the report by either clicking on the pages listed below, or by using the keyword search tool below to find specific information within the annual report.-
 1
1 -
2
-
3
-
4
-
5
-
6
-
7
-
8
-
9
-
10
-
11
-
12
-
13
-
14
-
15
-
16
-
17
-
18
-
19
-
20
-
21
-
22
-
23
-
24
-
25
-
26
-
27
-
28
-
29
-
30
-
31
-
32
-
33
-
34
-
35
-
36
-
37
-
38
-
39
-
40
-
41
-
42
-
43
-
44
-
45
-
46
-
47
-
48
-
49
-
50
-
51
-
52
-
53
-
54
-
55
-
56
-
57
-
58
-
59
-
60
-
61
-
62
-
63
-
64
-
65
-
66
-
67
-
68
-
69
-
70
-
71
-
72
-
73
-
74
-
75
-
76
-
77
-
78
-
79
-
80
-
81
-
82
-
83
-
84
-
85
-
86
-
87
-
88
-
89
-
90
-
91
-
92
-
93
-
94
-
95
-
96
-
 97
97 -
 98
98 -
 99
99 -
 100
100 -
 101
101 -
 102
102 -
 103
103 -
 104
104 -
 105
105 -
 106
106 -
 107
107 -
 108
108 -
 109
109 -
 110
110 -
 111
111 -
 112
112 -
 113
113 -
 114
114 -
 115
115 -
 116
116 -
 117
117 -
118
-
119
-
120
-
121
-
122
-
123
-
124
-
125
-
126
-
127
-
128
-
129
-
130
-
131
-
132
-
133
-
134
-
135
-
136
-
137
-
138
-
139
-
140
-
141
-
142
-
143
-
144
-
145
-
146
-
147
-
148
-
149
-
150
-
151
-
152
-
153
-
154
-
155
-
156
-
157
-
158
-
159
-
160
-
161
-
162
-
163
-
164
-
165
-
166
-
167
-
168
-
169
-
170
-
171
-
172
-
173
-
174
-
175
-
176
-
177
-
178
-
179
-
180
-
181
-
182
-
183
-
184
-
185
-
186
-
187
-
188
-
189
-
190
-
191
-
192
-
193
-
194
-
195
-
196
-
197
-
198
-
199
-
200
-
201
-
202
-
203
-
204
-
205
-
206
-
207
-
208
-
209
-
210
-
211
-
212
-
213
-
214
-
215
-
216
 |
 |

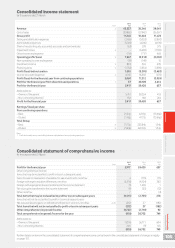
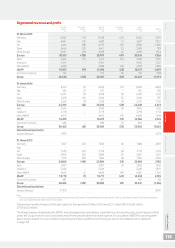
Consolidated income statement
for the years ended 31 March
2015 2014 2013
Note £m £m £m
Revenue 242,227 38,346 38,041
Cost of sales (30,882) (27,942) (26,567)
Gross prot 11,345 10,404 11,474
Selling and distribution expenses (3,455) (3,033) (2,860)
Administrative expenses (5,746) (4,245) (4,159)
Share of results of equity accounted associates and joint ventures (63) 278 575
Impairment losses 4–(6,600) (7,700)
Other income and expense (114) (717) 468
Operating prot/(loss) 31,967 (3,913) (2,202)
Non-operating income and expense (19) (149) 10
Investment income 5883 346 305
Financing costs 5(1,736) (1,554) (1,596)
Prot/(loss) before taxation 1,095 (5,270) (3,483)
Income tax credit/(expense) 64,765 16,582 (476)
Prot/(loss) for the nancial year from continuing operations 5,860 11,312 (3,959)
Prot for the nancial year from discontinued operations 757 48,108 4,616
Prot for the nancial year 5,917 59,420 657
Attributable to:
– Owners of the parent 5,761 59,254 413
– Non-controlling interests1156 166 244
Prot for the nancial year 5,917 59,420 657
Earnings/(loss) per share
From continuing operations:
– Basic 21.53p 42.10p (15.66p)
– Diluted 21.42p 41.77p (15.66p)
Total Group:
– Basic 821.75p 223.84p 1.54p
– Diluted 821.63p 222.07p 1.54p
Note:
1 Prot attributable to non-controlling interests solely derives from continuing operations.
Consolidated statement of comprehensive income
for the years ended 31 March
2015 2014 2013
Note £m £m £m
Prot for the nancial year 5,917 59,420 657
Other comprehensive income:
Items that may be reclassied to prot or loss in subsequent years:
Gains/(losses) on revaluation of available-for-sale investments, net of tax 4(119) (73)
Foreign exchange translation differences, net of tax (6,516) (4,104) 362
Foreign exchange (gains)/losses transferred to the income statement (1) 1,493 1
Fair value gains transferred to the income statement (9) (25) (12)
Other, net of tax 7 – (4)
Total items that may be reclassied to prot or loss in subsequent years (6,515) (2,755) 274
Items that will not be reclassied to prot or loss in subsequent years:
Net actuarial (losses)/gains on dened benet pension schemes, net of tax 6, 26 (212) 37 (182)
Total items that will not be reclassied to prot or loss in subsequent years (212) 37 (182)
Other comprehensive (expense)/income (6,727) (2,718) 92
Total comprehensive (expense)/income for the year (810) 56,702 749
Attributable to:
– Owners of the parent (1,076) 56,711 604
– Non-controlling interests 266 (9) 145
(810) 56,702 749
Further details on items in the consolidated statement of comprehensive income can be found in the consolidated statement of changes in equity
on page 107.
Overview Strategy review Performance Governance Financials Additional information Vodafone Group Plc
Annual Report 2015
105