Vodafone 2015 Annual Report Download - page 44
Download and view the complete annual report
Please find page 44 of the 2015 Vodafone annual report below. You can navigate through the pages in the report by either clicking on the pages listed below, or by using the keyword search tool below to find specific information within the annual report.-
 1
1 -
2
-
3
-
4
-
5
-
6
-
7
-
8
-
9
-
10
-
11
-
12
-
13
-
14
-
15
-
16
-
17
-
18
-
19
-
20
-
21
-
22
-
23
-
24
-
25
-
26
-
27
-
28
-
29
-
30
-
31
-
32
-
33
-
 34
34 -
 35
35 -
 36
36 -
 37
37 -
 38
38 -
 39
39 -
 40
40 -
 41
41 -
 42
42 -
 43
43 -
 44
44 -
 45
45 -
 46
46 -
 47
47 -
 48
48 -
 49
49 -
 50
50 -
 51
51 -
 52
52 -
 53
53 -
 54
54 -
55
-
56
-
57
-
58
-
59
-
60
-
61
-
62
-
63
-
64
-
65
-
66
-
67
-
68
-
69
-
70
-
71
-
72
-
73
-
74
-
75
-
76
-
77
-
78
-
79
-
80
-
81
-
82
-
83
-
84
-
85
-
86
-
87
-
88
-
89
-
90
-
91
-
92
-
93
-
94
-
95
-
96
-
97
-
98
-
99
-
100
-
101
-
102
-
103
-
104
-
105
-
106
-
107
-
108
-
109
-
110
-
111
-
112
-
113
-
114
-
115
-
116
-
117
-
118
-
119
-
120
-
121
-
122
-
123
-
124
-
125
-
126
-
127
-
128
-
129
-
130
-
131
-
132
-
133
-
134
-
135
-
136
-
137
-
138
-
139
-
140
-
141
-
142
-
143
-
144
-
145
-
146
-
147
-
148
-
149
-
150
-
151
-
152
-
153
-
154
-
155
-
156
-
157
-
158
-
159
-
160
-
161
-
162
-
163
-
164
-
165
-
166
-
167
-
168
-
169
-
170
-
171
-
172
-
173
-
174
-
175
-
176
-
177
-
178
-
179
-
180
-
181
-
182
-
183
-
184
-
185
-
186
-
187
-
188
-
189
-
190
-
191
-
192
-
193
-
194
-
195
-
196
-
197
-
198
-
199
-
200
-
201
-
202
-
203
-
204
-
205
-
206
-
207
-
208
-
209
-
210
-
211
-
212
-
213
-
214
-
215
-
216
 |
 |

Vodafone Group Plc
Annual Report 2015
42
Operating results (continued)
The adjusted effective tax rate for the year ended 31 March 2015 was
29.4%. The rate is in line with our expectation of a high twenties tax rate.
The adjusted effective tax rate includes a £185 million impact from
foreign exchange losses for which we are unable to take a tax deduction.
Excluding this impact the adjusted effective tax rate would be 27.2%.
The adjusted effective tax rate is expected to remain in the high twenties
over the medium term.
This tax rate does not include the impact of the recognition
of an additional £3,341 million deferred tax asset in respect of the
Group’s historical tax losses in Luxembourg. The losses have been
recognised as a consequence of the nancing arrangements for the
acquisition of Ono. The rate also excludes the deferred tax impact of the
use of Luxembourg losses in the year (£439 million) and an additional
asset in the year of £2,127 million arising from the revaluation
of investments based upon the local GAAP nancial statements.
The adjusted effective tax rate for the year ended 31 March 2014
has been restated to exclude the results and related tax expense
of Verizon Wireless and to show the adjusted tax rate as calculated
on the same basis as the current year. The rate excludes the recognition
of an additional deferred tax asset in respect of the Group’s historical tax
losses in Germany of £1,916 million and Luxembourg of £17,402 million,
the US tax liability of £2,210 million relating to the rationalisation and
reorganisation of our non-US assets prior to the disposal of our interest
in Verizon Wireless and excludes the deferred tax impact of the use
of Luxembourg losses in the year (£113 million).
Discontinued operations
On 2 September 2013 the Group announced it had reached
an agreement with Verizon Communications Inc. to dispose of its
US group whose principal asset was its 45% interest in VZW. The Group
ceased recognising its share of results in VZW on 2 September
2013, and classied its investment as a held for sale asset and the
results as a discontinued operation. The transaction completed
on 21 February 2014.
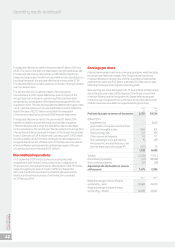
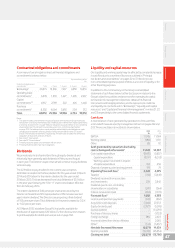
Earnings per share
Adjusted earnings per share from continuing operations, which excludes
the results and related tax charge of the Group’s former investment
in Verizon Wireless in the prior year and the recognition of deferred tax
assets in both years, was 5.55 pence, a decrease of 27.8% year-on-year,
reecting the Group’s lower adjusted operating prot.
Basic earnings per share decreased to 21.75 pence (2014: 223.84 pence)
due to the prior year impact of the disposal of the Group’s investment
in Verizon Wireless and the recognition of a higher deferred tax asset
in the prior year compared to the current year, as described above, both
of which have been excluded from adjusted earnings per share.
2015
£m
2014
£m
Prot attributable to owners of the parent 5,761 59,254
Adjustments:
Impairment loss –6,600
Amortisation of acquired customer base
and brand intangible assets 1,269 551
Restructuring costs 157 355
Other income and expense 114 717
Non-operating income and expense 19 149
Investment income and nancing costs
(see net nancing costs on page 41) (437) 78
1,122 8,450
Taxation (5,334) (17,511)
Discontinued operations (57) (48,108)
Non-controlling interests (21) (50)
Adjusted prot attributable to owners
ofthe parent 1,471 2,035
Million Million
Weighted average number of shares
outstanding – basic 26,489 26,472
Weighted average number of shares
outstanding – diluted 26,629 26,682