Vodafone 2015 Annual Report Download - page 146
Download and view the complete annual report
Please find page 146 of the 2015 Vodafone annual report below. You can navigate through the pages in the report by either clicking on the pages listed below, or by using the keyword search tool below to find specific information within the annual report.-
 1
1 -
2
-
3
-
4
-
5
-
6
-
7
-
8
-
9
-
10
-
11
-
12
-
13
-
14
-
15
-
16
-
17
-
18
-
19
-
20
-
21
-
22
-
23
-
24
-
25
-
26
-
27
-
28
-
29
-
30
-
31
-
32
-
33
-
34
-
35
-
36
-
37
-
38
-
39
-
40
-
41
-
42
-
43
-
44
-
45
-
46
-
47
-
48
-
49
-
50
-
51
-
52
-
53
-
54
-
55
-
56
-
57
-
58
-
59
-
60
-
61
-
62
-
63
-
64
-
65
-
66
-
67
-
68
-
69
-
70
-
71
-
72
-
73
-
74
-
75
-
76
-
77
-
78
-
79
-
80
-
81
-
82
-
83
-
84
-
85
-
86
-
87
-
88
-
89
-
90
-
91
-
92
-
93
-
94
-
95
-
96
-
97
-
98
-
99
-
100
-
101
-
102
-
103
-
104
-
105
-
106
-
107
-
108
-
109
-
110
-
111
-
112
-
113
-
114
-
115
-
116
-
117
-
118
-
119
-
120
-
121
-
122
-
123
-
124
-
125
-
126
-
127
-
128
-
129
-
130
-
131
-
132
-
133
-
134
-
135
-
 136
136 -
 137
137 -
 138
138 -
 139
139 -
 140
140 -
 141
141 -
 142
142 -
 143
143 -
 144
144 -
 145
145 -
 146
146 -
 147
147 -
 148
148 -
 149
149 -
 150
150 -
 151
151 -
 152
152 -
 153
153 -
 154
154 -
 155
155 -
 156
156 -
157
-
158
-
159
-
160
-
161
-
162
-
163
-
164
-
165
-
166
-
167
-
168
-
169
-
170
-
171
-
172
-
173
-
174
-
175
-
176
-
177
-
178
-
179
-
180
-
181
-
182
-
183
-
184
-
185
-
186
-
187
-
188
-
189
-
190
-
191
-
192
-
193
-
194
-
195
-
196
-
197
-
198
-
199
-
200
-
201
-
202
-
203
-
204
-
205
-
206
-
207
-
208
-
209
-
210
-
211
-
212
-
213
-
214
-
215
-
216
 |
 |

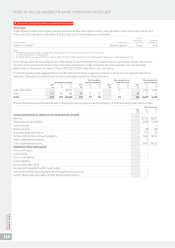
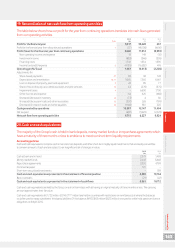
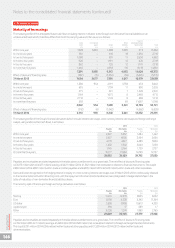
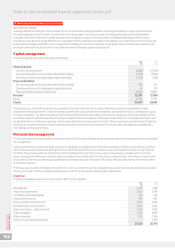
21. Borrowings
The Group’s sources of borrowing for funding and liquidity purposes come from a range of committed bank
facilities and through short-term and long-term issuances in the capital markets including bond and commercial
paper issues and bank loans. We manage the basis on which we incur interest on debt between xed interest rates
and oating interest rates depending on market conditions using interest rate derivatives. The Group enters into
foreign exchange contracts to mitigate the impact of exchange rate movements on certain monetary items.
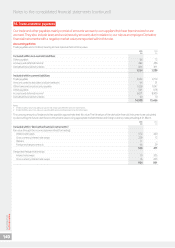
Accounting policies
Capital market and bank borrowings
Interest bearing loans and overdrafts are initially measured at fair value (which is equal to cost at inception), and are subsequently measured
at amortised cost, using the effective interest rate method, except where they are identied as a hedged item in a designated hedge relationship.
Any difference between the proceeds net of transaction costs and the amount due on settlement or redemption of borrowings is recognised over
the term of the borrowing.
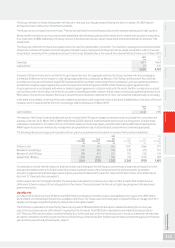
Carrying value and fair value information
2015 2014
Short-term Long-term Short-term Long-term
borrowings borrowings Total borrowings borrowings Total
£m £m £m £m £m £m
Financial liabilities measured at amortised cost:
Bank loans 1, 876 5 ,12 8 7, 00 4 1,263 4,647 5,910
Bank overdrafts 21 – 21 22 –22
Commercial paper 5,077 – 5,077 950 –950
Bonds 1,297 6,684 7,9 81 1,783 4,465 6,248
Other liabilities1,2,3 3,863 133 3,996 3,729 110 3,839
Bonds in designated hedge relationships 489 10,490 10,979 –12,232 12,232
12,623 22,435 35,058 7,747 21,454 29,201
Notes:
1 At 31 March 2015, amount includes £2,542 million (2014: £1,185 million) in relation to collateral support agreements.
2 Includes a £1.3 billion (2014: £1.4 billion) liability for payments due to holders of the equity shares in Kabel Deutschland AG under the terms of a domination and prot and loss
transfer agreement.
3 At 31 March 2014, amount includes £882 million in relation to the Piramal Healthcare option.
Bank loans include INR 457 billion (£4.9 billion) (2014: INR 425 billion (£4.3 billion)) of loans held by Vodafone India Limited (‘VIL’) and its subsidiaries
(the “VIL Group”). The VIL Group has a number of security arrangements supporting certain licences secured under the terms of agreements
between the Group, the Department of Telecommunications and the Government of India including certain share pledges of the shares within the
VIL Group. The terms and conditions of the security arrangements mean that, should members of the VIL Group not meet all of their loan payment
and performance obligations, the lenders may sell the pledged shares and enforce rights over the certain licences under the terms of the tri-party
agreements to recover their losses, with any remaining sales proceeds being returned to the VIL Group. Each of the eight legal entities within the VIL
Group provide cross guarantees to the lenders in respect of debt contracted by the other entities.
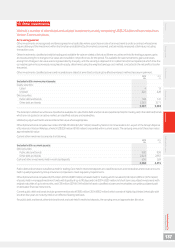
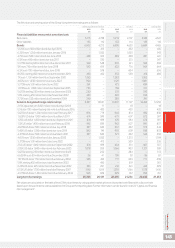
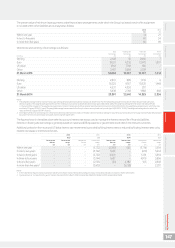
The fair value and carrying value of the Group’s short-term borrowings are as follows:
Sterling equivalentnominal value Fair value Carrying value
2015 2014 2015 2014 2015 2014
£m £m £m £m £m £m
Financial liabilities measured at amortised cost 10,689 5,655 10,843 5,964 10,837 5,964
Bonds: 1,265 1,756 1,309 1,771 1,297 1,783
Euro oating rate note due June 2014 – 929 – 930 – 930
4.625% sterling 350 million bond due
September2014 – 302 – 307 – 315
4.625% sterling 525 million bond due
September2014 – 525 – 534 – 538
5.125% euro 500 million bond due April 2015 361 –362 –379 –
6.25% euro 1,250 million bond due January 2016 904 –947 –918 –
Bonds in designated hedge relationships: 489 –489 –489 –
2.15% Japanese yen 3,000 million bond due
April2015 17 –17 –17 –
US dollar 700 million oating rate note due
February2016 472 –472 –472 –
Short-term borrowings 12,443 7,411 12,641 7,735 12,623 7,747
Notes to the consolidated nancial statements (continued)
Vodafone Group Plc
Annual Report 2015
144