Vodafone 2015 Annual Report Download - page 118
Download and view the complete annual report
Please find page 118 of the 2015 Vodafone annual report below. You can navigate through the pages in the report by either clicking on the pages listed below, or by using the keyword search tool below to find specific information within the annual report.-
 1
1 -
2
-
3
-
4
-
5
-
6
-
7
-
8
-
9
-
10
-
11
-
12
-
13
-
14
-
15
-
16
-
17
-
18
-
19
-
20
-
21
-
22
-
23
-
24
-
25
-
26
-
27
-
28
-
29
-
30
-
31
-
32
-
33
-
34
-
35
-
36
-
37
-
38
-
39
-
40
-
41
-
42
-
43
-
44
-
45
-
46
-
47
-
48
-
49
-
50
-
51
-
52
-
53
-
54
-
55
-
56
-
57
-
58
-
59
-
60
-
61
-
62
-
63
-
64
-
65
-
66
-
67
-
68
-
69
-
70
-
71
-
72
-
73
-
74
-
75
-
76
-
77
-
78
-
79
-
80
-
81
-
82
-
83
-
84
-
85
-
86
-
87
-
88
-
89
-
90
-
91
-
92
-
93
-
94
-
95
-
96
-
97
-
98
-
99
-
100
-
101
-
102
-
103
-
104
-
105
-
106
-
107
-
 108
108 -
 109
109 -
 110
110 -
 111
111 -
 112
112 -
 113
113 -
 114
114 -
 115
115 -
 116
116 -
 117
117 -
 118
118 -
 119
119 -
 120
120 -
 121
121 -
 122
122 -
 123
123 -
 124
124 -
 125
125 -
 126
126 -
 127
127 -
 128
128 -
129
-
130
-
131
-
132
-
133
-
134
-
135
-
136
-
137
-
138
-
139
-
140
-
141
-
142
-
143
-
144
-
145
-
146
-
147
-
148
-
149
-
150
-
151
-
152
-
153
-
154
-
155
-
156
-
157
-
158
-
159
-
160
-
161
-
162
-
163
-
164
-
165
-
166
-
167
-
168
-
169
-
170
-
171
-
172
-
173
-
174
-
175
-
176
-
177
-
178
-
179
-
180
-
181
-
182
-
183
-
184
-
185
-
186
-
187
-
188
-
189
-
190
-
191
-
192
-
193
-
194
-
195
-
196
-
197
-
198
-
199
-
200
-
201
-
202
-
203
-
204
-
205
-
206
-
207
-
208
-
209
-
210
-
211
-
212
-
213
-
214
-
215
-
216
 |
 |

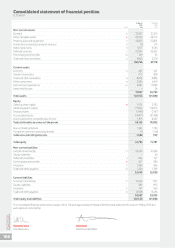
Notes to the consolidated nancial statements (continued)
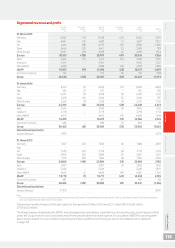
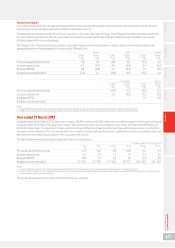
2. Segmental analysis (continued)
2015 2014 2013
£m £m £m
EBITDA 11,915 11,084 11,466
Depreciation, amortisation and loss on disposal of xed assets (8,345) (7,098) (6,502)
Share of results in associates and joint ventures (63) 324 626
Adjusted operating prot 3,507 4,310 5,590
Impairment loss –(6,600) (7,700)
Restructuring costs (157) (355) (311)
Amortisation of acquired customer based and brand intangible assets (1,269) (551) (249)
Other income and expense (114) (717) 468
Operating prot/(loss) 1,967 (3,913) (2,202)
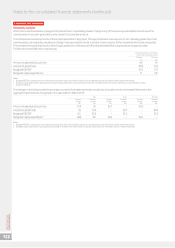
Segmental assets and cash ow
Other Depreciation
Non-current Capital expenditure on and Operating
assets1expenditure2 intangible assets amortisation Impairment loss free cash ow3
£m £m £m £m £m £m
31 March 2015
Germany 19,521 2,003 32,574 –1,002
Italy 6,938 1,105 95 1,334 –544
UK 7,759 980 15 1,363 –200
Spain 8,154 858 –954 –(29)
Other Europe 8,189 1,083 193 1,017 –543
Europe 50,561 6,029 306 7,242 –2,260
India 8,599 882 140 863 –332
Vodacom 4,712 745 2566 –762
Other AMAP 4,915 919 35 900 –409
AMAP 18,226 2,546 177 2,329 –1,503
Common Functions 1,306 622 1(6) –(900)
Group 70,093 9,197 484 9,565 –2,863
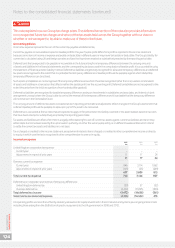
31 March 2014
Germany 22,780 1,312 3 2,036 4,900 1,706
Italy 7,9 8 4 180 – 164 – 251
UK 8,031 932 – 1,290 – 621
Spain 3,653 511 – 587 800 255
Other Europe 8,736 800 273 1,047 900 980
Europe 51,184 3,735 276 5,124 6,600 3,813
India 7, 824 633 1,938 828 – 812
Vodacom 4,560 663 3 593 – 1,174
Other AMAP 4,850 711 11 932 – 619
AMAP 17,234 2,007 1,952 2,353 – 2,605
Common Functions 1,12 1 571 – 83 – 161
Group 69,539 6,313 2,228 7,560 6,600 6,579
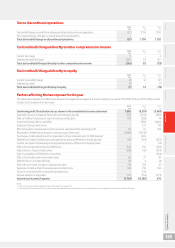
31 March 2013
Germany 19,10 9 1,073 2 1,423 – 1,795
Italy – – – – 4,500 –
UK 8,365 601 863 888 – 788
Spain 4,599 377 – 590 3,200 505
Other Europe 9,786 993 1,335 1,291 – 1,148
Europe 41,859 3,044 2,200 4,192 7,700 4,236
India 7,388 462 130 914 – 591
Vodacom 5,668 703 10 696 – 1,345
Other AMAP 5,826 678 90 894 – 619
AMAP 18,882 1,843 230 2,504 – 2,555
Common Functions 982 405 – (35) – (244)
Group 61,723 5,292 2,430 6,661 7,700 6,547
Notes:
1 Comprises goodwill, other intangible assets and property, plant and equipment.
2 Includes additions to property, plant and equipment and computer software, reported within intangibles. Excludes licences and spectrum additions.
3 The Group’s measure of segment cash ow, which primarily excludes capital expenditure, is reconciled to the closest equivalent GAAP measure cash generated by operations, on page 203.
Vodafone Group Plc
Annual Report 2015
116