Vodafone 2015 Annual Report Download - page 181
Download and view the complete annual report
Please find page 181 of the 2015 Vodafone annual report below. You can navigate through the pages in the report by either clicking on the pages listed below, or by using the keyword search tool below to find specific information within the annual report.-
 1
1 -
2
-
3
-
4
-
5
-
6
-
7
-
8
-
9
-
10
-
11
-
12
-
13
-
14
-
15
-
16
-
17
-
18
-
19
-
20
-
21
-
22
-
23
-
24
-
25
-
26
-
27
-
28
-
29
-
30
-
31
-
32
-
33
-
34
-
35
-
36
-
37
-
38
-
39
-
40
-
41
-
42
-
43
-
44
-
45
-
46
-
47
-
48
-
49
-
50
-
51
-
52
-
53
-
54
-
55
-
56
-
57
-
58
-
59
-
60
-
61
-
62
-
63
-
64
-
65
-
66
-
67
-
68
-
69
-
70
-
71
-
72
-
73
-
74
-
75
-
76
-
77
-
78
-
79
-
80
-
81
-
82
-
83
-
84
-
85
-
86
-
87
-
88
-
89
-
90
-
91
-
92
-
93
-
94
-
95
-
96
-
97
-
98
-
99
-
100
-
101
-
102
-
103
-
104
-
105
-
106
-
107
-
108
-
109
-
110
-
111
-
112
-
113
-
114
-
115
-
116
-
117
-
118
-
119
-
120
-
121
-
122
-
123
-
124
-
125
-
126
-
127
-
128
-
129
-
130
-
131
-
132
-
133
-
134
-
135
-
136
-
137
-
138
-
139
-
140
-
141
-
142
-
143
-
144
-
145
-
146
-
147
-
148
-
149
-
150
-
151
-
152
-
153
-
154
-
155
-
156
-
157
-
158
-
159
-
160
-
161
-
162
-
163
-
164
-
165
-
166
-
167
-
168
-
169
-
170
-
 171
171 -
 172
172 -
 173
173 -
 174
174 -
 175
175 -
 176
176 -
 177
177 -
 178
178 -
 179
179 -
 180
180 -
 181
181 -
 182
182 -
 183
183 -
 184
184 -
 185
185 -
 186
186 -
 187
187 -
 188
188 -
 189
189 -
 190
190 -
 191
191 -
192
-
193
-
194
-
195
-
196
-
197
-
198
-
199
-
200
-
201
-
202
-
203
-
204
-
205
-
206
-
207
-
208
-
209
-
210
-
211
-
212
-
213
-
214
-
215
-
216
 |
 |

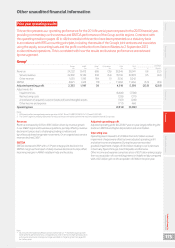
India
Service revenue increased 13.0%*, driven by continued customer
growth and data usage as well as improved voice pricing.
Mobile customers increased by 14.2 million during the year, yielding
a closing customer base of 166.6 million at 31 March 2014.
Data usage grew 125% during the year, primarily resulting from a 39%
increase in mobile internet users and a 67% increase in usage per
customer. At 31 March 2014 active data customers totalled 52 million
including seven million 3G customers.
We progressively rolled out M-Pesa across India over the year, reaching
nationwide coverage by March 2014.
EBITDA grew 20.8%*, with a 2.0* percentage point increase in EBITDA
margin, driven by the higher revenue and the resulting economies
of scale on costs.
In February, Vodafone India successfully bid for additional spectrum
in 11 telecom circles in the Indian Government’s 900MHz and 1800MHz
spectrum auction, enabling the company to provide customers with
enhanced mobile voice and data services across the country. Of the
total £1.9 billion cost of these spectrum licences, £0.5 billion was paid
during the nancial year with the remainder payable in instalments
starting in 2017.
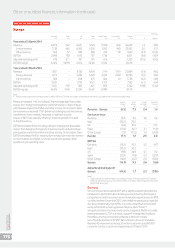
Vodacom
Service revenue grew 4.1%*, driven by strong growth in Vodacom’s
mobile operations outside South Africa. In South Africa, organic service
revenue increased 0.3%*, despite the adverse impact of an MTR cut,
due to the strong growth in data revenues of 23.5%*, driven by higher
smartphone penetration and the strong demand for prepaid bundles.
Vodacom’s mobile operations outside South Africa delivered service
revenue growth of 18.9%* mainly from continued customer base
growth. M-Pesa continued to perform well and is now operational in all
of the Vodacom mobile operations outside of South Africa, with over
4.4 million customers actively using the service.
EBITDA increased 6.6%*, driven by revenue growth, optimisation
in customer investment and efciencies in South Africa operating
costs. The EBITDA margin decline of 0.3* percentage points is the result
of higher sales of lower margin handsets.
On 14 April 2014 Vodacom announced the acquisition of the Vodacom
customer base from Nashua, a mobile cellular provider for South
African mobile network operators, subject to the approval of the
Competition Authority.
On 19 May 2014 Vodacom announced that it had reached
an agreement with the shareholders of Neotel Proprietary Limited
(‘Neotel’), the second largest provider of xed telecommunications
services for both enterprise and consumers in South Africa, to acquire
100% of the issued share capital in, and shareholder loans against,
Neotel for a total cash consideration of ZAR 7.0 billion (£0.4 billion).
The transaction remains subject to the fullment of a number
of conditions precedent including applicable regulatory approvals and
is expected to close before the end of the nancial year.
Other AMAP
Service revenue increased 5.7%*, with growth in Turkey, Egypt, Qatar
and Ghana being partially offset by declines in New Zealand.
Service revenue growth in Turkey was 7.9%* after a 5.4 percentage point
negative impact from voice and SMS MTR cuts effective from 1 July
2013. Mobile in-bundle revenue in Turkey grew 25.0%* driven by higher
smartphone penetration, the success of Vodafone Red plans and
continued growth in enterprise.
In Egypt service revenue increased 2.6%*, driven by the growth in the
customer base, higher data usage and a successful pricing strategy.
Service revenue growth in Qatar came as a result of strong net customer
additions and the success of segmented commercial offers. In Ghana,
service revenue grew 19.3%*, driven by an increase in customers and
higher data usage in both consumer and enterprise.
EBITDA grew 9.8%* with a 0.1* percentage point improvement in EBITDA
margin, with improvements in Turkey, Qatar and Ghana driven by the
increase in scale and operating cost efciencies, and with robust
contribution from Egypt, partially offset by a decline in New Zealand.
Our joint venture in Australia experienced a local currency service
revenue decline of 9.0%. The turnaround plan remains on track, yielding
improved levels of network performance, net promoter score and
customer base management. The local currency EBITDA margin was
improved by 14.6 percentage points, as a result of restructuring and
stronger cost discipline.
Our associate in Kenya, Safaricom, increased local currency service
revenue by 17.2% driven by a higher customer base and continued
growth in M-Pesa.
Overview Strategy review Performance Governance Financials Additional information Vodafone Group Plc
Annual Report 2015
179