Vodafone 2015 Annual Report Download - page 205
Download and view the complete annual report
Please find page 205 of the 2015 Vodafone annual report below. You can navigate through the pages in the report by either clicking on the pages listed below, or by using the keyword search tool below to find specific information within the annual report.-
 1
1 -
2
-
3
-
4
-
5
-
6
-
7
-
8
-
9
-
10
-
11
-
12
-
13
-
14
-
15
-
16
-
17
-
18
-
19
-
20
-
21
-
22
-
23
-
24
-
25
-
26
-
27
-
28
-
29
-
30
-
31
-
32
-
33
-
34
-
35
-
36
-
37
-
38
-
39
-
40
-
41
-
42
-
43
-
44
-
45
-
46
-
47
-
48
-
49
-
50
-
51
-
52
-
53
-
54
-
55
-
56
-
57
-
58
-
59
-
60
-
61
-
62
-
63
-
64
-
65
-
66
-
67
-
68
-
69
-
70
-
71
-
72
-
73
-
74
-
75
-
76
-
77
-
78
-
79
-
80
-
81
-
82
-
83
-
84
-
85
-
86
-
87
-
88
-
89
-
90
-
91
-
92
-
93
-
94
-
95
-
96
-
97
-
98
-
99
-
100
-
101
-
102
-
103
-
104
-
105
-
106
-
107
-
108
-
109
-
110
-
111
-
112
-
113
-
114
-
115
-
116
-
117
-
118
-
119
-
120
-
121
-
122
-
123
-
124
-
125
-
126
-
127
-
128
-
129
-
130
-
131
-
132
-
133
-
134
-
135
-
136
-
137
-
138
-
139
-
140
-
141
-
142
-
143
-
144
-
145
-
146
-
147
-
148
-
149
-
150
-
151
-
152
-
153
-
154
-
155
-
156
-
157
-
158
-
159
-
160
-
161
-
162
-
163
-
164
-
165
-
166
-
167
-
168
-
169
-
170
-
171
-
172
-
173
-
174
-
175
-
176
-
177
-
178
-
179
-
180
-
181
-
182
-
183
-
184
-
185
-
186
-
187
-
188
-
189
-
190
-
191
-
192
-
193
-
194
-
 195
195 -
 196
196 -
 197
197 -
 198
198 -
 199
199 -
 200
200 -
 201
201 -
 202
202 -
 203
203 -
 204
204 -
 205
205 -
 206
206 -
 207
207 -
 208
208 -
 209
209 -
 210
210 -
 211
211 -
 212
212 -
 213
213 -
 214
214 -
 215
215 -
216
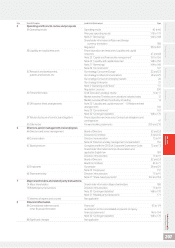
 |
 |
2015
Restated1
2014
Restated1
2013
£m £m £m
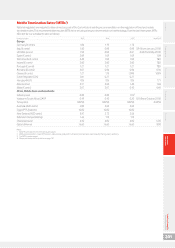
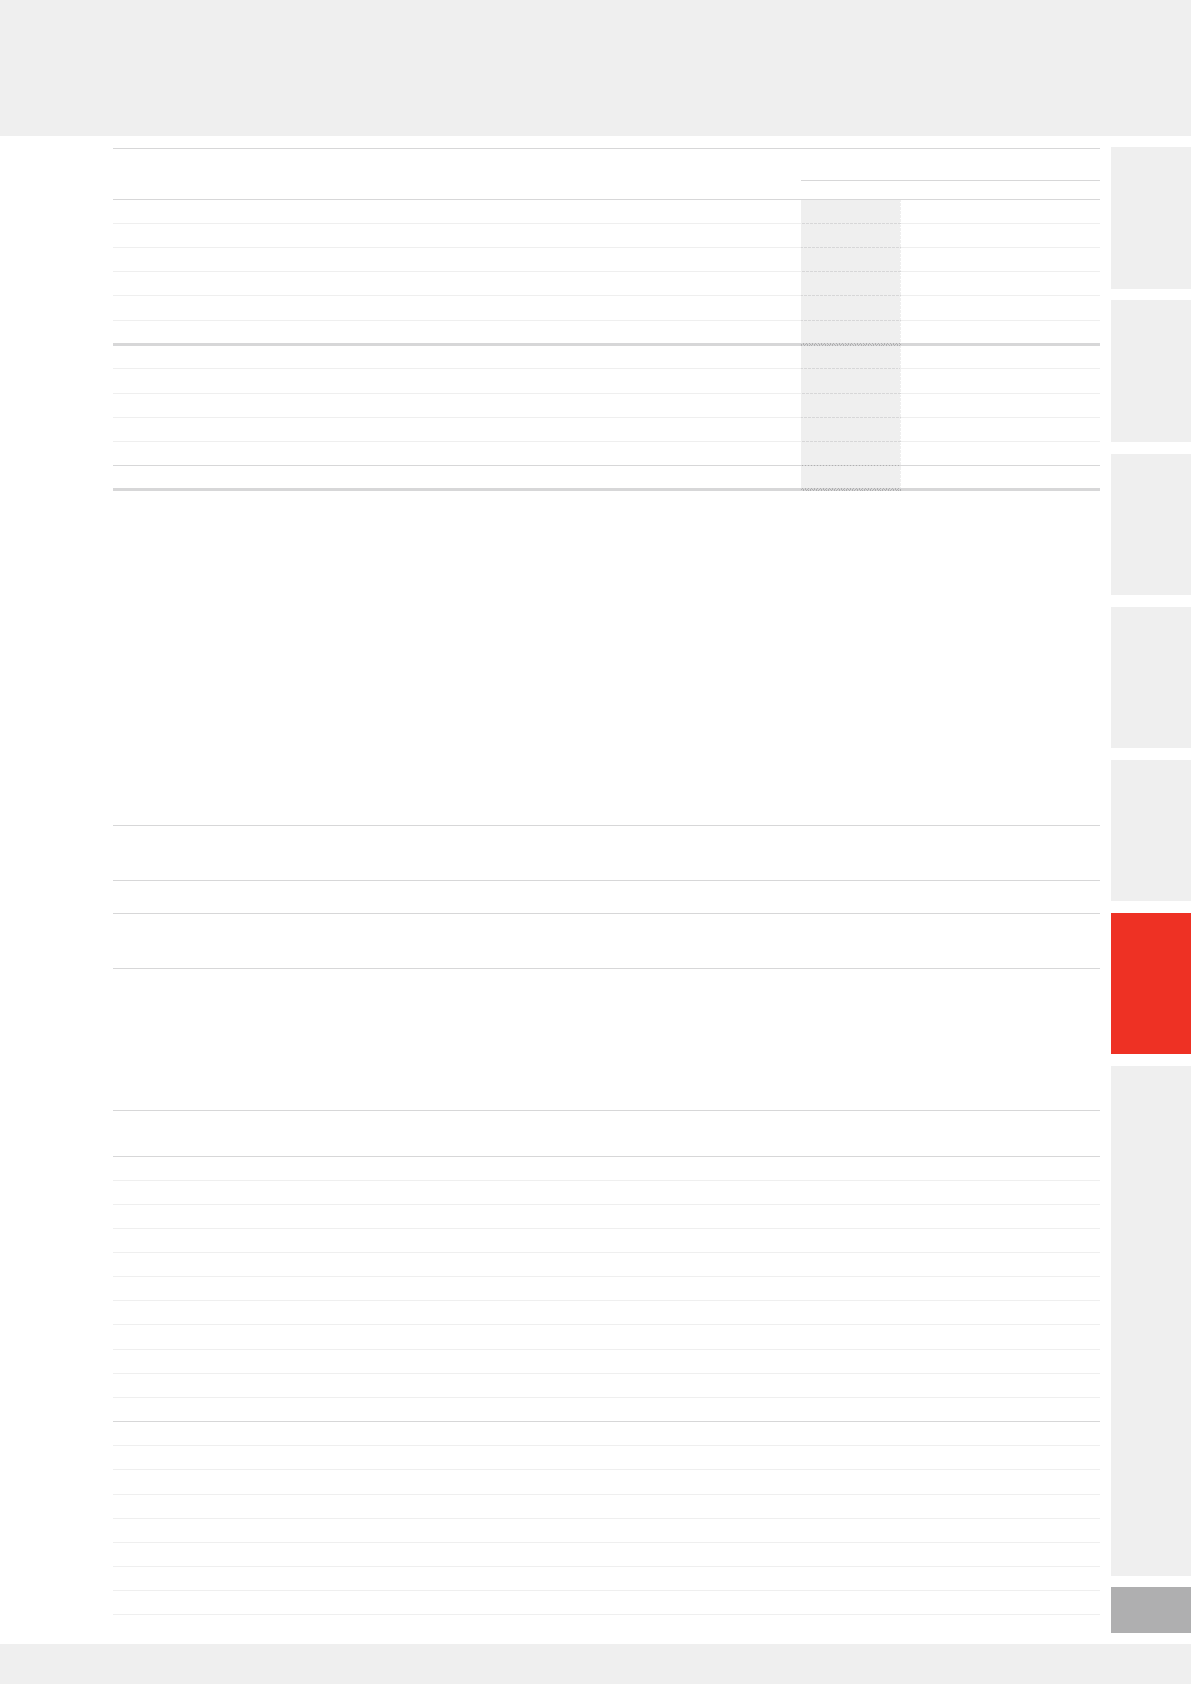
Cash generated by operations (refer to note 19) 10,397 12,147 11,493
Capital expenditure (9,197) (6,313) (5,292)
Working capital movement in respect of capital expenditure 762 456 74
Disposal of property, plant and equipment 178 79 105
Restructuring costs 336 210 167
Other movements2387 – –
Operating free cash ow12,863 6,579 6,547
Taxation (758) (3,449) (2,570)
Dividends received from associates 224 2,842 3,132
Dividends paid to non-controlling shareholders in subsidiaries (246) (264) (379)
Interest received and paid (995) (1,315) (1,058)
Free cash ow11,088 4,393 5,672
Notes:
1 Operating free cash ow and free cash ow have been redened to exclude restructuring costs for the year ended 31 March 2015 of £336 million (2014: £210 million; 2013: £167 million).
2 Other movements for the year ended 31 March 2015 include a £365 million UK pensions contribution payment and £116 million of KDG incentive scheme payments in respect of liabilities
assumed on acquisition.
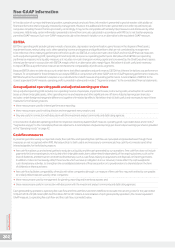
Other
Certain of the statements within the section titled “Chief Executive’s strategic review” on pages 14 to 17 contain forward-looking non-GAAP nancial
information for which at this time there is no comparable GAAP measure and which at this time cannot be quantitatively reconciled to comparable
GAAP nancial information. Certain of the statements within the section titled “Looking ahead” on page 39 contains forward-looking non-GAAP
nancial information which at this time cannot be quantitatively reconciled to comparable GAAP nancial information.
Organic growth
All amounts in this document marked with an “*” represent organic growth which presents performance on a comparable basis, both in terms
ofmerger and acquisition activity and foreign exchange rates. We believe that “organic growth”, which is not intended to be a substitute for
or superior to reported growth, provides useful and necessary information to investors and other interested parties for the following reasons:
a it provides additional information on underlying growth of the business without the effect of certain factors unrelated to the operating
performance of the business;
a it is used for internal performance analysis; and
a it facilitates comparability of underlying growth with other companies, although the term “organic” is not a dened term under IFRS and may not,
therefore, be comparable with similarly titled measures reported by other companies.
For the 2015 nancial year, the Group’s organic service revenue growth rate has been adjusted to exclude the benecial impact of a settlement
of an historical interconnect rate dispute in the UK, the benecial impact of an upward revision to interconnect revenue in Egypt from a re-estimation
by management of the appropriate historical mobile interconnection rate and the adverse impact of an adjustment to intercompany revenue.
The adjustments in relation to Vodafone UK and Vodafone Egypt also impact the disclosed organic growth rates for those countries.
Reconciliation of organic growth to reported growth is shown where used, or in the table below:
Period
Organic
change
%
Other
activity1
pps
Foreign
exchange
pps
Reported
change
%
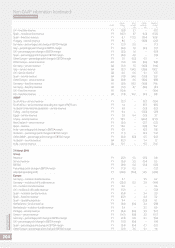
31 March 2015
Group
Revenue FY (0.8) 17. 8 (6.9) 10 .1
Service revenue FY (1.6) 17. 7 (6.7) 9.4
Fixed line revenue FY 3.5 38.6 (6.9) 35.2
Vodafone Global Enterprise service revenue FY 1.8 –(4.0) (2.2)
Machine-to-machine revenue FY 24.7 29.5 (8.5) 45.7
EBITDA FY (6.9) 21.4 ( 7. 0) 7. 5
Percentage point change in EBITDA margin FY (1.8) 1.2 (0.1) (0.7)
Adjusted operating prot FY (24.1) 11. 0 (5.5) (18.6)
EBITDA H2 (3.6) 18.4 (5.3) 9.5
Europe
Germany – mobile service revenue FY (3.5) 0 .1 (6.6) (10.1)
Germany – xed line revenue FY (2.1) 38.7 (9.9) 26.7
Italy – mobile service revenue FY (12.1) 902.8 (124.4) 766 .3
Italy – xed line revenue FY 4.5 1,022.0 (135.1) 891.4
Italy – operating expenses FY (3.1) 1,079.3 (149.3) 926.9
Italy – customer costs FY (3.0) 775.9 (108.1) 664.8
UK – mobile service revenue FY 0.5 –0.0 0.6
Overview Strategy review Performance Governance Financials Additional
information Vodafone Group Plc
Annual Report 2015
203