Vodafone 2015 Annual Report Download - page 130
Download and view the complete annual report
Please find page 130 of the 2015 Vodafone annual report below. You can navigate through the pages in the report by either clicking on the pages listed below, or by using the keyword search tool below to find specific information within the annual report.-
 1
1 -
2
-
3
-
4
-
5
-
6
-
7
-
8
-
9
-
10
-
11
-
12
-
13
-
14
-
15
-
16
-
17
-
18
-
19
-
20
-
21
-
22
-
23
-
24
-
25
-
26
-
27
-
28
-
29
-
30
-
31
-
32
-
33
-
34
-
35
-
36
-
37
-
38
-
39
-
40
-
41
-
42
-
43
-
44
-
45
-
46
-
47
-
48
-
49
-
50
-
51
-
52
-
53
-
54
-
55
-
56
-
57
-
58
-
59
-
60
-
61
-
62
-
63
-
64
-
65
-
66
-
67
-
68
-
69
-
70
-
71
-
72
-
73
-
74
-
75
-
76
-
77
-
78
-
79
-
80
-
81
-
82
-
83
-
84
-
85
-
86
-
87
-
88
-
89
-
90
-
91
-
92
-
93
-
94
-
95
-
96
-
97
-
98
-
99
-
100
-
101
-
102
-
103
-
104
-
105
-
106
-
107
-
108
-
109
-
110
-
111
-
112
-
113
-
114
-
115
-
116
-
117
-
118
-
119
-
 120
120 -
 121
121 -
 122
122 -
 123
123 -
 124
124 -
 125
125 -
 126
126 -
 127
127 -
 128
128 -
 129
129 -
 130
130 -
 131
131 -
 132
132 -
 133
133 -
 134
134 -
 135
135 -
 136
136 -
 137
137 -
 138
138 -
 139
139 -
 140
140 -
141
-
142
-
143
-
144
-
145
-
146
-
147
-
148
-
149
-
150
-
151
-
152
-
153
-
154
-
155
-
156
-
157
-
158
-
159
-
160
-
161
-
162
-
163
-
164
-
165
-
166
-
167
-
168
-
169
-
170
-
171
-
172
-
173
-
174
-
175
-
176
-
177
-
178
-
179
-
180
-
181
-
182
-
183
-
184
-
185
-
186
-
187
-
188
-
189
-
190
-
191
-
192
-
193
-
194
-
195
-
196
-
197
-
198
-
199
-
200
-
201
-
202
-
203
-
204
-
205
-
206
-
207
-
208
-
209
-
210
-
211
-
212
-
213
-
214
-
215
-
216
 |
 |

Notes to the consolidated nancial statements (continued)
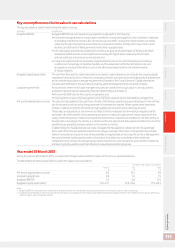
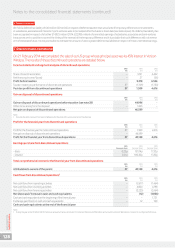
6. Taxation (continued)
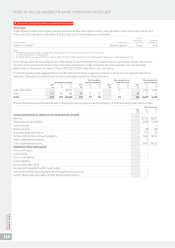
We hold a deferred tax liability of £40 million (2014: £nil) in respect of deferred taxation that would arise if temporary differences on investments
in subsidiaries, associates and interests in joint ventures were to be realised after the balance sheet date (see table above). No deferred tax liability has
been recognised in respect of a further £14,925 million (2014: £22,985 million) of unremitted earnings of subsidiaries, associates and joint ventures
because we are in a position to control the timing of the reversal of the temporary difference and it is probable that such differences will not reverse
in the foreseeable future. It is not practicable to estimate the amount of unrecognised deferred tax liabilities in respect of these unremitted earnings.
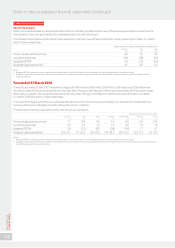
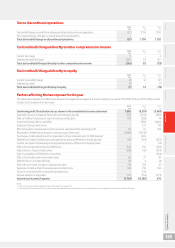
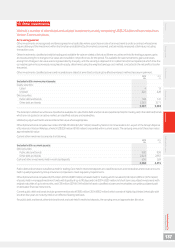
7. Discontinued operations
On 21 February 2014 we completed the sale of our US group whose principal asset was its 45% interest in Verizon
Wireless. The results of these discontinued operations are detailed below.
Income statement and segment analysis of discontinued operations
2015 2014 2013
£m £m £m
Share of result in associates –3,191 6,422
Net nancing income/(costs) –27 (56)
Prot before taxation –3,218 6,366
Taxation relating to performance of discontinued operations 57 (1,709) (1,750)
Post-tax prot from discontinued operations 57 1,509 4,616
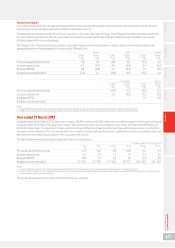
Gain on disposal of discontinued operations
2015 2014 2013
£m £m £m
Gain on disposal of discontinued operations before taxation (see note 28) –44,996 –
Other items arising from the disposal1–1,603 –
Net gain on disposal of discontinued operations –46,599 –
Note:
1 Includes dividends received from Verizon Wireless after the date of the announcement of the disposal.
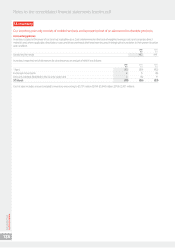
Prot for the nancial year from discontinued operations
2015 2014 2013
£m £m £m
Prot for the nancial year from discontinued operations 57 1,509 4,616
Net gain on disposal of discontinued operations –46,599 –
Prot for the nancial year from discontinued operations 57 48,108 4,616
Earnings per share from discontinued operations
2015 2014 2013
Pence per share Pence per share Pence per share
– Basic 0.22p 181.74p 17.20p
– Diluted 0.21p 180.30p 17.20p
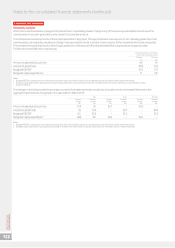
Total comprehensive income for the nancial year from discontinued operations
2015 2014 2013
£m £m £m
Attributable to owners of the parent 57 48,108 4,616
Cash ows from discontinued operations1
2015 2014 2013
£m £m £m
Net cash ows from operating activities –(2,617) (1,464)
Net cash ows from investing activities –4,830 4,798
Net cash ows from nancing activities –(2,225) (5,164)
Net (decrease)/increase in cash and cash equivalents –(12) (1,830)
Cash and cash equivalents at the beginning of the nancial year – – 1,721
Exchange gain/(loss) on cash and cash equivalents –12 109
Cash and cash equivalents at the end of the nancial year – – –
Note:
1 During the year ended 31 March 2015, the Group received a nal tax distribution from Verizon Wireless of £359 million and a taxation refund of £84 million in relation to our disposed US Group.
Vodafone Group Plc
Annual Report 2015
128