Vodafone 2015 Annual Report Download - page 159
Download and view the complete annual report
Please find page 159 of the 2015 Vodafone annual report below. You can navigate through the pages in the report by either clicking on the pages listed below, or by using the keyword search tool below to find specific information within the annual report.-
 1
1 -
2
-
3
-
4
-
5
-
6
-
7
-
8
-
9
-
10
-
11
-
12
-
13
-
14
-
15
-
16
-
17
-
18
-
19
-
20
-
21
-
22
-
23
-
24
-
25
-
26
-
27
-
28
-
29
-
30
-
31
-
32
-
33
-
34
-
35
-
36
-
37
-
38
-
39
-
40
-
41
-
42
-
43
-
44
-
45
-
46
-
47
-
48
-
49
-
50
-
51
-
52
-
53
-
54
-
55
-
56
-
57
-
58
-
59
-
60
-
61
-
62
-
63
-
64
-
65
-
66
-
67
-
68
-
69
-
70
-
71
-
72
-
73
-
74
-
75
-
76
-
77
-
78
-
79
-
80
-
81
-
82
-
83
-
84
-
85
-
86
-
87
-
88
-
89
-
90
-
91
-
92
-
93
-
94
-
95
-
96
-
97
-
98
-
99
-
100
-
101
-
102
-
103
-
104
-
105
-
106
-
107
-
108
-
109
-
110
-
111
-
112
-
113
-
114
-
115
-
116
-
117
-
118
-
119
-
120
-
121
-
122
-
123
-
124
-
125
-
126
-
127
-
128
-
129
-
130
-
131
-
132
-
133
-
134
-
135
-
136
-
137
-
138
-
139
-
140
-
141
-
142
-
143
-
144
-
145
-
146
-
147
-
148
-
 149
149 -
 150
150 -
 151
151 -
 152
152 -
 153
153 -
 154
154 -
 155
155 -
 156
156 -
 157
157 -
 158
158 -
 159
159 -
 160
160 -
 161
161 -
 162
162 -
 163
163 -
 164
164 -
 165
165 -
 166
166 -
 167
167 -
 168
168 -
 169
169 -
170
-
171
-
172
-
173
-
174
-
175
-
176
-
177
-
178
-
179
-
180
-
181
-
182
-
183
-
184
-
185
-
186
-
187
-
188
-
189
-
190
-
191
-
192
-
193
-
194
-
195
-
196
-
197
-
198
-
199
-
200
-
201
-
202
-
203
-
204
-
205
-
206
-
207
-
208
-
209
-
210
-
211
-
212
-
213
-
214
-
215
-
216
 |
 |

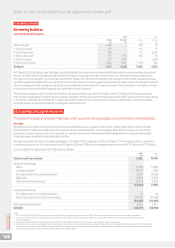
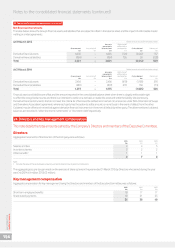
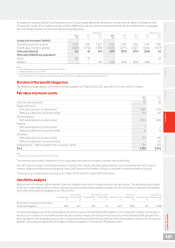
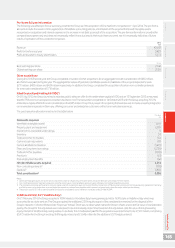
25. Employees
This note shows the average number of people employed by the Group during the year, in which areas of our
business our employees work and where they are based. It also shows total employment costs.
2015 2014 2013
Employees Employees Employees
By activity:
Operations 17,602 14,947 13,736
Selling and distribution 35,629 31,342 29,658
Customer care and administration 52,069 42,857 39,19 8
105,300 89,146 82,592
By segment:
Germany 14,520 10,623 11,0 88
Italy 6,757 1,123 –
Spain 5,324 3,552 4,223
UK 12,437 12,979 8,319
Other Europe 15,190 15,392 19,995
Europe 54,228 43,669 43,625
India 12,303 11,925 11,339
Vodacom 7,260 7,176 7,311
Other Africa, Middle East and Asia Pacic 14,312 16,002 12,659
Africa, Middle East and Asia Pacic 33,875 35,103 31,309
Non-Controlled Interests and Common Functions 17,197 10,374 7,658
Total 105,300 89,146 82,592
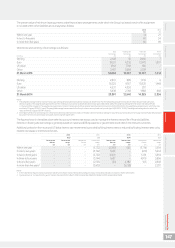
The cost incurred in respect of these employees (including Directors) was:
2015 2014 2013
£m £m £m
Wages and salaries 3,469 3 ,261 2,989
Social security costs 442 364 350
Other pension costs (note 26) 195 158 157
Share-based payments (note 27) 88 92 124
4,194 3,875 3,620
Overview Strategy review Performance Governance Financials Additional information Vodafone Group Plc
Annual Report 2015
157