Vodafone 2015 Annual Report Download - page 215
Download and view the complete annual report
Please find page 215 of the 2015 Vodafone annual report below. You can navigate through the pages in the report by either clicking on the pages listed below, or by using the keyword search tool below to find specific information within the annual report.-
 1
1 -
2
-
3
-
4
-
5
-
6
-
7
-
8
-
9
-
10
-
11
-
12
-
13
-
14
-
15
-
16
-
17
-
18
-
19
-
20
-
21
-
22
-
23
-
24
-
25
-
26
-
27
-
28
-
29
-
30
-
31
-
32
-
33
-
34
-
35
-
36
-
37
-
38
-
39
-
40
-
41
-
42
-
43
-
44
-
45
-
46
-
47
-
48
-
49
-
50
-
51
-
52
-
53
-
54
-
55
-
56
-
57
-
58
-
59
-
60
-
61
-
62
-
63
-
64
-
65
-
66
-
67
-
68
-
69
-
70
-
71
-
72
-
73
-
74
-
75
-
76
-
77
-
78
-
79
-
80
-
81
-
82
-
83
-
84
-
85
-
86
-
87
-
88
-
89
-
90
-
91
-
92
-
93
-
94
-
95
-
96
-
97
-
98
-
99
-
100
-
101
-
102
-
103
-
104
-
105
-
106
-
107
-
108
-
109
-
110
-
111
-
112
-
113
-
114
-
115
-
116
-
117
-
118
-
119
-
120
-
121
-
122
-
123
-
124
-
125
-
126
-
127
-
128
-
129
-
130
-
131
-
132
-
133
-
134
-
135
-
136
-
137
-
138
-
139
-
140
-
141
-
142
-
143
-
144
-
145
-
146
-
147
-
148
-
149
-
150
-
151
-
152
-
153
-
154
-
155
-
156
-
157
-
158
-
159
-
160
-
161
-
162
-
163
-
164
-
165
-
166
-
167
-
168
-
169
-
170
-
171
-
172
-
173
-
174
-
175
-
176
-
177
-
178
-
179
-
180
-
181
-
182
-
183
-
184
-
185
-
186
-
187
-
188
-
189
-
190
-
191
-
192
-
193
-
194
-
195
-
196
-
197
-
198
-
199
-
200
-
201
-
202
-
203
-
204
-
 205
205 -
 206
206 -
 207
207 -
 208
208 -
 209
209 -
 210
210 -
 211
211 -
 212
212 -
 213
213 -
 214
214 -
 215
215 -
 216
216
 |
 |

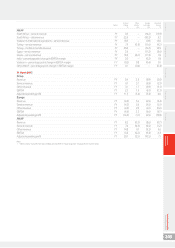
The selected nancial data shown below for the years ended 31 March 2015, 2014, 2013 and 2012 is presented
on a statutory basis. As permitted by IFRS 11, the nancial data for the year ended 31 March 2011 has not been
restated and includes the Group’s joint ventures on a proportionate consolidation basis, rather than on an equity
accounting basis, and includes the results of the Group’s investment in Verizon Wireless in continuing operations.
At/for the year ended 31 March 2015 2014 2013 2012 2011
Consolidated income statement data (£m)
Revenue 42,227 38,346 38,041 38,821 45,884
Operating prot/(loss) 1,967 (3,913) (2,202) 5,618 5,596
Prot/(loss) before taxation 1,095 (5,270) (3,483) 4,144 9,498
Prot/(loss) for nancial year from continuing operations 5,860 11,312 (3,959) 3,439 7,870
Prot for the nancial year 5,917 59,420 657 6,994 7,870
Consolidated statement of nancial position data (£m)
Total assets 122,573 121,840 138,324 135,450 151,220
Total equity 67,733 71,781 72,488 78,202 87,561
Total equity shareholders’ funds 66,145 70,802 71,477 76,935 87,555
Earnings per share1,2
Weighted average number of shares (millions)
– Basic 26,489 26,472 26,831 27,624 28,586
– Diluted 26,629 26,682 26,831 27,938 28,926
Basic earnings per ordinary share 21.75p 223.84p 1.54p 25.15p 27.87p
Diluted earnings per ordinary share 21.63p 222.07p 1.54p 24.87p 27.55p
Basic earnings per share from continuing operations 21.53p 42.10p (15.66p) 12.28p 27.87p
Cash dividends1,3
Amount per ordinary share (pence) 11.22p 11.00p 10.19p 13.52p 8.90p
Amount per ADS (pence) 111.2p 110.0p 101.9p 135.2p 89.0p
Amount per ordinary share (US cents) 16.65c 18.31c 15.49c 21.63c 14.33c
Amount per ADS (US cents) 166.5c 183.1c 154.9c 216.3c 143.3c
Other data
Ratio of earnings to xed charges41.6 –1.7 4.3 5.8
Deciency between xed charges and earnings (£m)4–654 – – –
Notes:
1 See note 8 to the consolidated nancial statements, “Earnings per share”. Earnings and dividends per ADS is calculated by multiplying earnings per ordinary share by ten, the number of ordinary
shares per ADS. Dividend per ADS is calculated on the same basis.
2 On 19 February 2014, we announced a “6 for 11” share consolidation effective 24 February 2014. This had the effect of reducing the number of shares in issue from 52,821,751,216 ordinary
shares (including 4,351,833,492 ordinary shares held in Treasury) as at the close of business on 18 February 2014 to 28,811,864,298 new ordinary shares in issue immediately after the share
consolidation on 24 February 2014. Earnings per share for the years ended 31 March 2013, 2012 and 2011 have been restated accordingly.
3 The nal dividend for the year ended 31 March 2015 was proposed by the Directors on 19 May 2015 and is payable on 5 August 2015 to holders of record as of 12 June 2015. The total dividends
have been translated into USdollars at 31 March 2015 for purposes of the above disclosure but the dividends are payable in US dollars under the terms of the ADS depositary agreement.
4 For the purposes of calculating these ratios, earnings consist of loss or prot before tax adjusted for xed charges, dividend income from associates, share of prots and losses from associates,
interest capitalised and interest amortised. Fixed charges comprise one third of payments under operating leases, representing the estimated interest element of these payments, interest
payable and similar charges, interest capitalised and preferred share dividends.
Vodafone, the Vodafone Portrait, the Vodafone
Speechmark, Vodacom, M-Pesa, Vodafone One Net,
Vodafone Red and JustTextGiving are trade marks of the
Vodafone Group. The Vodafone Rhombus is a registered
design of the Vodafone Group. Other product and
company names mentioned herein may be the trade
marks of their respective owners.
The content of our website (vodafone.com) should not
be considered to form part of this annual report or our
annual report onForm 20-F.
© Vodafone Group 2015
Text printed on amadeus 75 silk which is made from
75% de-inked post-consumer waste and 25% virgin
bre. The cover is on amadeus 100silk, made entirely
from de-inked post-consumer waste. Both products
areForest Stewardship Council (‘FSC’) certied
andproduced using elemental chlorine free (‘ECF’)
bleaching. The manufacturing mill also holds ISO 14001
accreditation for environmental management.
Designed and produced by Radley Yeldar ry.com
Overview Strategy review Performance Governance Financials Additional
information Vodafone Group Plc
Annual Report 2015
213
Selected nancial data
Unaudited information