Vodafone 2015 Annual Report Download - page 12
Download and view the complete annual report
Please find page 12 of the 2015 Vodafone annual report below. You can navigate through the pages in the report by either clicking on the pages listed below, or by using the keyword search tool below to find specific information within the annual report.-
 1
1 -
 2
2 -
 3
3 -
 4
4 -
 5
5 -
 6
6 -
 7
7 -
 8
8 -
 9
9 -
 10
10 -
 11
11 -
 12
12 -
 13
13 -
 14
14 -
 15
15 -
 16
16 -
 17
17 -
 18
18 -
 19
19 -
 20
20 -
 21
21 -
 22
22 -
23
-
24
-
25
-
26
-
27
-
28
-
29
-
30
-
31
-
32
-
33
-
34
-
35
-
36
-
37
-
38
-
39
-
40
-
41
-
42
-
43
-
44
-
45
-
46
-
47
-
48
-
49
-
50
-
51
-
52
-
53
-
54
-
55
-
56
-
57
-
58
-
59
-
60
-
61
-
62
-
63
-
64
-
65
-
66
-
67
-
68
-
69
-
70
-
71
-
72
-
73
-
74
-
75
-
76
-
77
-
78
-
79
-
80
-
81
-
82
-
83
-
84
-
85
-
86
-
87
-
88
-
89
-
90
-
91
-
92
-
93
-
94
-
95
-
96
-
97
-
98
-
99
-
100
-
101
-
102
-
103
-
104
-
105
-
106
-
107
-
108
-
109
-
110
-
111
-
112
-
113
-
114
-
115
-
116
-
117
-
118
-
119
-
120
-
121
-
122
-
123
-
124
-
125
-
126
-
127
-
128
-
129
-
130
-
131
-
132
-
133
-
134
-
135
-
136
-
137
-
138
-
139
-
140
-
141
-
142
-
143
-
144
-
145
-
146
-
147
-
148
-
149
-
150
-
151
-
152
-
153
-
154
-
155
-
156
-
157
-
158
-
159
-
160
-
161
-
162
-
163
-
164
-
165
-
166
-
167
-
168
-
169
-
170
-
171
-
172
-
173
-
174
-
175
-
176
-
177
-
178
-
179
-
180
-
181
-
182
-
183
-
184
-
185
-
186
-
187
-
188
-
189
-
190
-
191
-
192
-
193
-
194
-
195
-
196
-
197
-
198
-
199
-
200
-
201
-
202
-
203
-
204
-
205
-
206
-
207
-
208
-
209
-
210
-
211
-
212
-
213
-
214
-
215
-
216
 |
 |

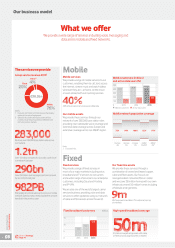
Our business model (continued)
Spectrum, network
and IT infrastructure
We use our spectrum licences to provide
the radio frequencies needed to deliver
communications services. We combine our
base station sites and our expertise in network
management to transmit signals for mobile
services. Through our xed broadband assets
(cable, bre and copper) and wholesale
agreements with other operators, we provide
broadband, voice and TV services. Our IT estate
provides our data centres, customer
relationship capability, customer billing
services and online resources.
Revenue
The majority of our revenue comes
from selling mobile voice, text and data.
Mobile users pay either monthly via xed
term contracts (typically up to two years
in length) or prepay by topping up their airtime
in advance of usage. Enterprise customers
are typically on contracts that last between
two to three years. Over 90% of our mobile
customers are individual consumers and
the rest are enterprise customers. A growing
share of mobile revenue arises from monthly
fees rather than metered access, which
is much more vulnerable to competitive and
economic pressures.
Fixed customers typically pay via one to two
year contracts, and as a result xed revenue
streams are more stable than mobile.
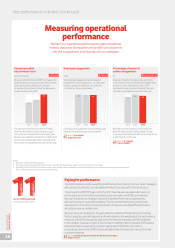
Cash ow
Our track record of converting revenue
into cash ow is strong – with some
£11.2 billion generated over the last three
years. We achieve this by operating efcient
networks where we seek to minimise costs,
thus supporting our gross margin.
We also have strong local market share
positions – as we are typically the rst
or second largest mobile operator in each
of our markets with a share of more than 20%.
This provides in-market scale efciencies
to support our EBITDA margin, which in turn
provides healthy cash ow.
Reinvestment
Our cash ow helps us to maintain a high
level of investment to give our customers
a superior network experience, which over
time should enable us to secure a premium
positioning in most of our markets. We also
continue to participate in spectrum auctions
to secure a strong portfolio of spectrum.
Over the last three years we have committed
£21 billion in capital investment in networks,
IT and distribution, a further £4 billion
on the renewal and acquisition of spectrum
and £13 billion on acquiring new xed
line businesses.
Shareholder returns
The cash generated from operations allows
us to sustain generous shareholder returns
while also investing in the future prosperity
of the business.
In the 2014 calendar year we were the
fth largest dividend payer in the
FTSE 100. Over the last three years we have
returned almost £13 billion to shareholders,
in the form of ordinary dividends, excluding
share buy backs and the Verizon Wireless
Return of Value. In addition we have increased
the dividend per share every year for more
than 15 years.
How we make money
We invest in superior telecommunications networks so that we can
sustain high levels of cash generation, reward shareholders and reinvest
in the business – thus creating a virtuous circle of investment,
revenue, strong cash conversion and reinvestment.
Beyond nancial
value – towards a
sustainable business
Our core business is founded on a powerful
social good: we help millions of customers
communicate, share, create, learn and
grow, and the rapid expansion of our
networks is having a profound impact
on the way people manage their daily lives.
Everyone we deal with, from our
customers, shareholders, partners and
suppliers, to our employees, regulators
and NGOs, rightly expect everyone
at Vodafone to act responsibly and with
integrity at all times. The beliefs, aspirations
and concerns of thisdiverse range
of stakeholders consequently shape our
performance and success, inuencing the
way we make decisions.
We know that nancial results alone are
not enough: the societies and communities
within which we operate want companies
to focus on enhancing lives and livelihoods
and overlooking that expectation would
risk undermining our prospects for long-
term value creation.
More on Sustainable business:
Page 30
Vodafone Group Plc
Annual Report 2015
10