Vodafone 2015 Annual Report Download - page 41
Download and view the complete annual report
Please find page 41 of the 2015 Vodafone annual report below. You can navigate through the pages in the report by either clicking on the pages listed below, or by using the keyword search tool below to find specific information within the annual report.-
 1
1 -
2
-
3
-
4
-
5
-
6
-
7
-
8
-
9
-
10
-
11
-
12
-
13
-
14
-
15
-
16
-
17
-
18
-
19
-
20
-
21
-
22
-
23
-
24
-
25
-
26
-
27
-
28
-
29
-
30
-
 31
31 -
 32
32 -
 33
33 -
 34
34 -
 35
35 -
 36
36 -
 37
37 -
 38
38 -
 39
39 -
 40
40 -
 41
41 -
 42
42 -
 43
43 -
 44
44 -
 45
45 -
 46
46 -
 47
47 -
 48
48 -
 49
49 -
 50
50 -
 51
51 -
52
-
53
-
54
-
55
-
56
-
57
-
58
-
59
-
60
-
61
-
62
-
63
-
64
-
65
-
66
-
67
-
68
-
69
-
70
-
71
-
72
-
73
-
74
-
75
-
76
-
77
-
78
-
79
-
80
-
81
-
82
-
83
-
84
-
85
-
86
-
87
-
88
-
89
-
90
-
91
-
92
-
93
-
94
-
95
-
96
-
97
-
98
-
99
-
100
-
101
-
102
-
103
-
104
-
105
-
106
-
107
-
108
-
109
-
110
-
111
-
112
-
113
-
114
-
115
-
116
-
117
-
118
-
119
-
120
-
121
-
122
-
123
-
124
-
125
-
126
-
127
-
128
-
129
-
130
-
131
-
132
-
133
-
134
-
135
-
136
-
137
-
138
-
139
-
140
-
141
-
142
-
143
-
144
-
145
-
146
-
147
-
148
-
149
-
150
-
151
-
152
-
153
-
154
-
155
-
156
-
157
-
158
-
159
-
160
-
161
-
162
-
163
-
164
-
165
-
166
-
167
-
168
-
169
-
170
-
171
-
172
-
173
-
174
-
175
-
176
-
177
-
178
-
179
-
180
-
181
-
182
-
183
-
184
-
185
-
186
-
187
-
188
-
189
-
190
-
191
-
192
-
193
-
194
-
195
-
196
-
197
-
198
-
199
-
200
-
201
-
202
-
203
-
204
-
205
-
206
-
207
-
208
-
209
-
210
-
211
-
212
-
213
-
214
-
215
-
216
 |
 |

Overview Strategy review Performance Governance Financials Additional information Vodafone Group Plc
Annual Report 2015
39
Acquisition integration
We commenced integration of KDG in April
2014 and of Ono in August 2014. In total
we expect to generate combined annual
cost and capex synergies of approximately
€540 million in the 2018 nancial year, mainly
from migrating xed and mobile customers
onto our own infrastructure and combining
backhaul and core networks.
In terms of standalone business performance,
KDG has continued to grow strongly and
even showed some acceleration through the
year, supported by rm pricing and improved
subscriber growth. Ono’s performance has
been a little below expectations, with ARPU
coming under more pressure than anticipated
as a result of aggressive pricing at the premium
end of the market.
The teams have made solid progress on all
aspects of integration. In Germany, we have
started to connect Vodafone base station sites
to KDG bre backhaul, and have migrated
77,000 customers to date off our DSL platform
(on which we pay high monthly fees) onto
KDG’s cable infrastructure. 70% of IP trafc has
now been combined, and we have launched
our combined xed/mobile proposition, “All
in One”.
In Spain, we have so far connected over
500 mobile base station sites to Ono’s bre
to save on backhaul costs. We also signed
an agreement with Telefónica, the host
of Ono’s MVNO, to accelerate the migration
of trafc to our own network. We are launching
a truly integrated, single-billed, xed/mobile
proposition this summer.
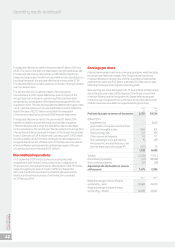
EBITDA £ billion
11.5
2013 2014 2015
11.1 11.9
0
5
10
15
Free cash ow and £ billion
ordinary dividends paid
4.8
5.7
2013 2014 2015
4.4
5.1
1.1
2.9
0
4
2
6
Free cash ow Dividend
Cost efciency
Progress on costs was good this year, with
operating costs in Europe at in organic terms,
despite the cost growth driven by the Project
Spring network roll-out. Savings came from
further development of our shared services
platform, increased centralised procurement,
headcount reductions and other efciencies.
Looking ahead, for a relatively lean
organisation such as Vodafone, a pure focus
on “cost cutting” can be an over-simplistic
approach that could compromise the quality
of service we provide to customers, which
would clearly be self-defeating.
Instead, we are looking at cost in two ways
which can make a signicant long term
difference to our overall efciency. First, we are
focusing on productivity improvements –
doing the same things better at a lower cost,
by developing cross-functional programmes
and benchmarking more forensically between
different parts of the business. In some cases,
this will require us to invest more in the short
term – for example, in new, standardised
IT systems – to deliver transformational
efciencies longer term.
Second, we are embedding a stronger
cost-conscious culture at an individual level
throughout the business, including personal
objectives on efciency targets for senior
management incentives. Both of these
elements will be underpinned by more
granular and consistent cost and productivity
reporting across markets and functions.
We have instigated a programme called “Fit
for Growth” to encompass both of these
objectives, and to develop an organisation with
improved competitiveness and agility for the
long term.
Performance against 2015
nancial year guidance
Based on guidance foreign exchange rates,
our EBITDA was £11.7 billion, within our
guidance range of £11.3 billion to £11.9 billion
set in May 2014, and our range of £11.6 billion
to £11.9 billion set in November 2014. On the
same basis our free cash ow was £1.3 billion,
in line with our guidance of positive free
cash ow.
Looking ahead
The key goals for the year ahead are to build
on the improving commercial execution
evident last year, and to complete the
second half of the Project Spring programme
as successfully as the rst half. We expect
EBITDA to be in the range of £11.5 billion
to £12.0 billion1, with further tight control
on costs and good progress on the integration
of our cable acquisitions. We expect free cash
ow to be positive1 even after the second
year of elevated Project Spring capex, giving
us condence that we will return to a dividend
that is comfortably covered by free cash ow
when capex returns to more normal levels
in future years.
Nick Read
Chief Financial Ofcer
Note:
1 Guidance for the 2016 nancial year is based on our
current assessment of the global macroeconomic
outlook and assumes foreign exchange rates of £1:€1.37,
£1:INR95.2, £1:ZAR18.1. It excludes the impact of licences
and spectrum purchases, material one-off tax-related
payments, restructuring costs and any fundamental
structural changes to the eurozone. It also assumes
no material change to the current structure of the Group.