Vodafone 2015 Annual Report Download - page 32
Download and view the complete annual report
Please find page 32 of the 2015 Vodafone annual report below. You can navigate through the pages in the report by either clicking on the pages listed below, or by using the keyword search tool below to find specific information within the annual report.-
 1
1 -
2
-
3
-
4
-
5
-
6
-
7
-
8
-
9
-
10
-
11
-
12
-
13
-
14
-
15
-
16
-
17
-
18
-
19
-
20
-
21
-
 22
22 -
 23
23 -
 24
24 -
 25
25 -
 26
26 -
 27
27 -
 28
28 -
 29
29 -
 30
30 -
 31
31 -
 32
32 -
 33
33 -
 34
34 -
 35
35 -
 36
36 -
 37
37 -
 38
38 -
 39
39 -
 40
40 -
 41
41 -
 42
42 -
43
-
44
-
45
-
46
-
47
-
48
-
49
-
50
-
51
-
52
-
53
-
54
-
55
-
56
-
57
-
58
-
59
-
60
-
61
-
62
-
63
-
64
-
65
-
66
-
67
-
68
-
69
-
70
-
71
-
72
-
73
-
74
-
75
-
76
-
77
-
78
-
79
-
80
-
81
-
82
-
83
-
84
-
85
-
86
-
87
-
88
-
89
-
90
-
91
-
92
-
93
-
94
-
95
-
96
-
97
-
98
-
99
-
100
-
101
-
102
-
103
-
104
-
105
-
106
-
107
-
108
-
109
-
110
-
111
-
112
-
113
-
114
-
115
-
116
-
117
-
118
-
119
-
120
-
121
-
122
-
123
-
124
-
125
-
126
-
127
-
128
-
129
-
130
-
131
-
132
-
133
-
134
-
135
-
136
-
137
-
138
-
139
-
140
-
141
-
142
-
143
-
144
-
145
-
146
-
147
-
148
-
149
-
150
-
151
-
152
-
153
-
154
-
155
-
156
-
157
-
158
-
159
-
160
-
161
-
162
-
163
-
164
-
165
-
166
-
167
-
168
-
169
-
170
-
171
-
172
-
173
-
174
-
175
-
176
-
177
-
178
-
179
-
180
-
181
-
182
-
183
-
184
-
185
-
186
-
187
-
188
-
189
-
190
-
191
-
192
-
193
-
194
-
195
-
196
-
197
-
198
-
199
-
200
-
201
-
202
-
203
-
204
-
205
-
206
-
207
-
208
-
209
-
210
-
211
-
212
-
213
-
214
-
215
-
216
 |
 |
Sustainable business
Sustainable business
Our signicant global footprint combined with the power of our
communications technology can help transform people’s lives. This enables
us to align our business growth with ourgoalto be a sustainable business.
Communications technology is acknowledged
to be transformative in improving people’s
lives and livelihoods, as well as driving
economic growth and development.
Estimates show that a 10% increase in
mobile penetration in emerging markets
leads to a 4.2% rise in long-term productivity1.
Vodafone contributes to the socio-economic
development of our customers by using
technology to tackle some of the most
pressing challenges faced by society today,
with signicant contributions in the areas
of education and skills development, access
to nancial services and resource efciency.
How we achieve our goals is critical
to the long-term success of the business.
Our approach is driven by a commitment
to operate in an ethical and responsible
manner in all we do. This report highlights our
progress in four critical areas.
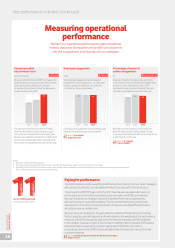
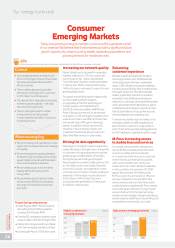
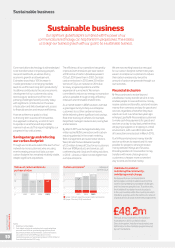
Saving energy and reducing
our carbon footprint
Though we continue to extend the reach of our
network to more customers, who are using
ever-increasing amounts of data, our own
carbon footprint has remained relatively stable,
despite signicant acquisitions.
The efciency of our operations has greatly
improved, with emissions per base station
at 9.9 tonnes of carbon dioxide equivalent
(‘CO2e’), 33% lower than in 2007. Our total
carbon emissions in 2015 were 2.8 million
tonnes of CO2e, an increase on 2014 due
to newly acquired operations and the
expansion of our network. We remain
committed to reduce our energy consumption
as far as possible, through energy efciency
measures and renewable investments.
As a market leader in M2M solutions, we have
a great opportunity to help our enterprise
customers to cut their carbon emissions,
while delivering them signicant cost savings.
Real-time tracking of vehicles, for example,
helps eet managers revise routes, saving fuel
and emissions.
By March 2015, we had approximately nine
million active M2M connections with carbon-
reducing potential in the smart metering,
eet management and automotive sectors.
We estimate that we delivered savings
of 3.5 million tonnes of CO2e for our customers
from our M2M products and services, call
conferencing and cloud and hosting solutions,
in 2015 – almost a million tonnes higher than
our total emissions.
We are now working towards a new goal
for our carbon footprint: within three years
we aim to enable our customers to reduce
their carbon emissions by twice the
amount of carbon we generate through our
own activities.
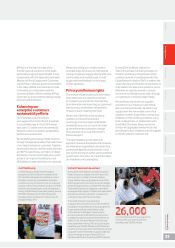
Financial inclusion
M-Pesa continues to evolve beyond
a traditional money transfer service. It now
enables people to save and borrow money,
receive salaries and benets, send and receive
money from overseas, and pay for goods and
services, regardless of whether they have
a bank account. Launched two years ago
in Kenya, Lipa Na M-Pesa enables customers
to make cash-free payments for goods and
services on a day-to-day basis, whether they
are paying a supplier, or shopping in a retail
environment, with over £80 million worth
of transactions enacted just in March 2015.
Our M-Pesa international money transfer
service continues to expand and it is now
possible for people to send and receive
money between Kenya and Tanzania.
Providing senders of cross-border money
transfers with more choice gives our
customers a cheaper, more convenient
wayto send and receive money.
Vodafone Foundation:
mobilising the community,
mobilising social change
We believe that our communications
technologies can help to address some of the
world’s most pressing humanitarian challenges
and thus improve people’s lives. To achieve this,
the Vodafone Foundation invests in projects
in the communities within the countries in which
Vodafone operates, and is the centre of a network
of global and local social investment programmes.
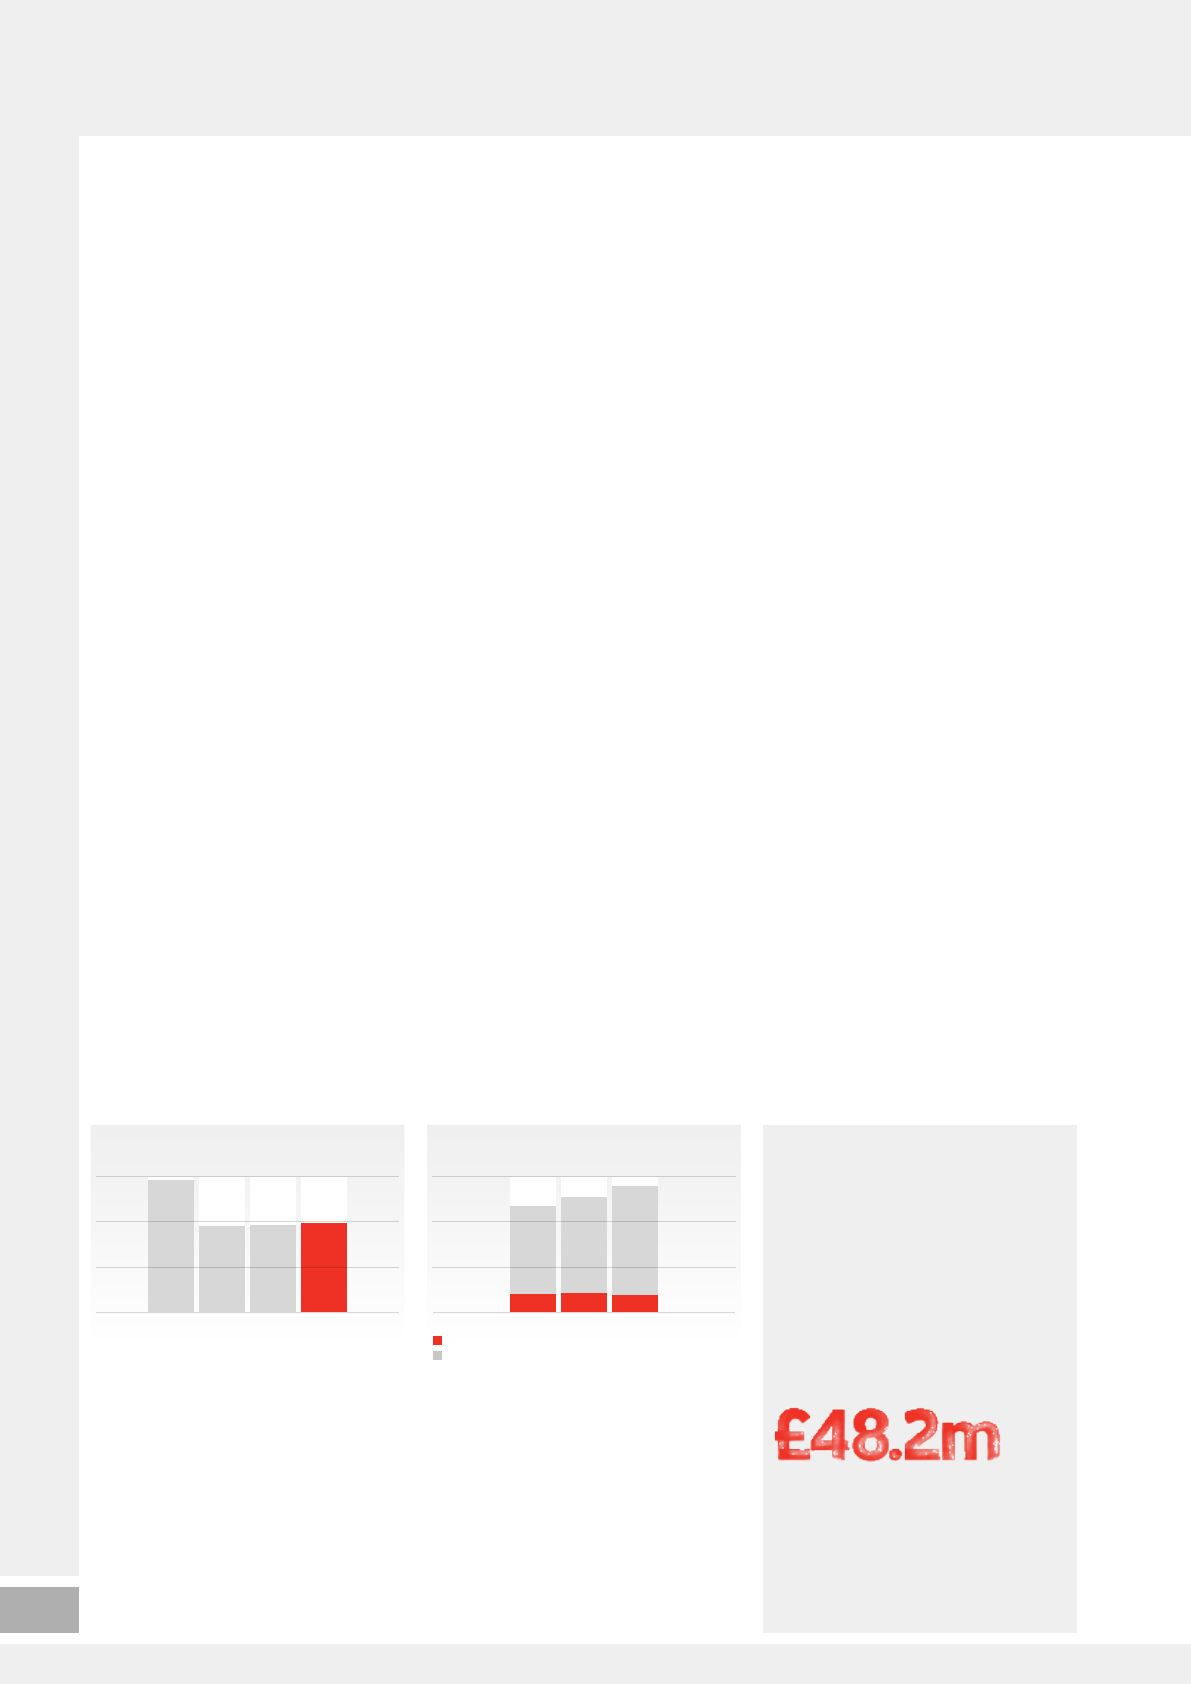
The total amount donated to the Vodafone
Foundations in 2015 was £48.2 million.
Since its inception, Vodafone has donated over
£520 million to the charitable programmes led
by our Foundations.
Notes:
1 Deloitte and the GSMA.
2 Calculated using local market actual or estimated data
sourced from invoices, purchasing requisitions, direct
data measurement and estimations. Carbon emissions
calculated in line with DEFRA guidance. For full
methodology see our Sustainability Report 2015. KDG and
Ono data included for 2015 only.
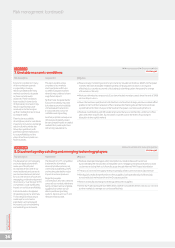
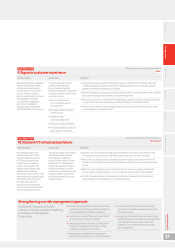
Carbon emissions2 millions of
tonnes CO2e
Tonnes of carbon emissions
per base station
9.5
14.7
20132007 2014 2015
9.7 9.9
0
5
10
15
2.36
2013 2014 2015
2.55 2.80
0
2
1
3
Scope 1 (direct greenhouse gas (‘GHG’) emissions)
Scope 2 (indirect GHG emissions)
Vodafone Group Plc
Annual Report 2015
30