Vodafone 2015 Annual Report Download - page 42
Download and view the complete annual report
Please find page 42 of the 2015 Vodafone annual report below. You can navigate through the pages in the report by either clicking on the pages listed below, or by using the keyword search tool below to find specific information within the annual report.-
 1
1 -
2
-
3
-
4
-
5
-
6
-
7
-
8
-
9
-
10
-
11
-
12
-
13
-
14
-
15
-
16
-
17
-
18
-
19
-
20
-
21
-
22
-
23
-
24
-
25
-
26
-
27
-
28
-
29
-
30
-
31
-
 32
32 -
 33
33 -
 34
34 -
 35
35 -
 36
36 -
 37
37 -
 38
38 -
 39
39 -
 40
40 -
 41
41 -
 42
42 -
 43
43 -
 44
44 -
 45
45 -
 46
46 -
 47
47 -
 48
48 -
 49
49 -
 50
50 -
 51
51 -
 52
52 -
53
-
54
-
55
-
56
-
57
-
58
-
59
-
60
-
61
-
62
-
63
-
64
-
65
-
66
-
67
-
68
-
69
-
70
-
71
-
72
-
73
-
74
-
75
-
76
-
77
-
78
-
79
-
80
-
81
-
82
-
83
-
84
-
85
-
86
-
87
-
88
-
89
-
90
-
91
-
92
-
93
-
94
-
95
-
96
-
97
-
98
-
99
-
100
-
101
-
102
-
103
-
104
-
105
-
106
-
107
-
108
-
109
-
110
-
111
-
112
-
113
-
114
-
115
-
116
-
117
-
118
-
119
-
120
-
121
-
122
-
123
-
124
-
125
-
126
-
127
-
128
-
129
-
130
-
131
-
132
-
133
-
134
-
135
-
136
-
137
-
138
-
139
-
140
-
141
-
142
-
143
-
144
-
145
-
146
-
147
-
148
-
149
-
150
-
151
-
152
-
153
-
154
-
155
-
156
-
157
-
158
-
159
-
160
-
161
-
162
-
163
-
164
-
165
-
166
-
167
-
168
-
169
-
170
-
171
-
172
-
173
-
174
-
175
-
176
-
177
-
178
-
179
-
180
-
181
-
182
-
183
-
184
-
185
-
186
-
187
-
188
-
189
-
190
-
191
-
192
-
193
-
194
-
195
-
196
-
197
-
198
-
199
-
200
-
201
-
202
-
203
-
204
-
205
-
206
-
207
-
208
-
209
-
210
-
211
-
212
-
213
-
214
-
215
-
216
 |
 |

Vodafone Group Plc
Annual Report 2015
40
Operating results
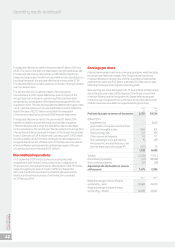
Group1
Europe
£m
AMAP
£m
Other2
£
Eliminations
£m
2015
£m
2014
£m
% change
£Organic
Revenue 28,071 13,482 754 (80) 42,227 38,346 10.1 (0.8)
Service revenue 25,972 12 ,035 569 (79) 38,497 35,190 9.4 (1.6)
Other revenue 2,099 1,447 185 (1) 3,730 3,156
EBITDA 7, 924 4,097 (106) –11, 9 15 11, 0 84 7. 5 (6.9)
Adjusted operating prot 1,763 1,813 (69) –3,507 4,310 (18.6) (24.1)
Adjustments for:
Impairment loss –(6,600)
Restructuring costs (157) (355)
Amortisation of acquired customer bases and brand intangible assets (1,269) (551)
Other income and expense (114) (717)
Operating prot/(loss) 1,967 (3,913)
Non-operating income and expense (19) (149)
Net nancing costs (853) (1,208)
Income tax credit 4,765 16,582
Prot for the nancial year from continuing operations 5,860 11,312
Prot for the nancial year from discontinued operations 57 48,108
Prot for the nancial year 5,917 59,420
Notes:
1 2015 results reect average foreign exchange rates of £1:€1.28, £1:INR 98.51 and £1:ZAR 17.82.
2 Common Functions primarily represent the results of the partner markets and the net result of unallocated central Group costs.
Revenue
Group revenue increased by 10.1% to £42.2 billion and service revenue
increased 9.4% to £38.5 billion. Reported growth rates reect the
acquisitions of KDG in October 2013 and of Ono in July 2014, as well
as the consolidation of Italy after we increased our ownership to 100%
in February 2014.
In Europe, organic service revenue declined by 4.7%* as growing
demand for 4G and data services continues to be offset by challenging
competitive and macroeconomic pressures and the impact of MTR cuts.
In AMAP, organic service revenue increased by 5.8%* driven
by continued growth in India, Turkey, Ghana, Qatar and Egypt, partially
offset by declines in Vodacom and New Zealand.
EBITDA
Group EBITDA rose 7.5% to £11.9 billion, with organic EBITDA down
6.9%*, mainly affected by revenue declines in Europe. The Group
EBITDA margin fell 0.7 percentage points to 28.2%, or 1.8* percentage
points on an organic basis.
This reects ongoing revenue declines in Europe and the growth
in operating expenses as a result of Project Spring, partially offset
by operating efciencies. H2 EBITDA fell 3.6%*, with the improved trend
supported by the better revenue performance and continued good
cost control.
Operating prot
Adjusted operating prot excludes certain income and expenses that
we have identied separately to allow their effect on the results of the
Group to be assessed (see page 202). The items that are included
in operating prot but are excluded from adjusted operating prot are
discussed below.
No impairment losses were recognised in the current nancial year
(2014: £6,600 million). Further detail is provided in note 4 to the
Group’s consolidated nancial statements.
Restructuring costs of £157 million (2014: £355 million) have been
incurred to improve future business performance and reduce costs.
Our nancial performance
This section presents our operating performance, providing commentary
on how the revenue and the EBITDA performance of the Group and its
operating segments within the Europe and AMAP regions, together with
Common Functions, have developed over the last year. See pages 175 to 179
for commentary on the 2014 nancial year. The results in this section are
presented on a statutory basis, in accordance with IFRS accounting principles,
as this is assessed as being the most insightful presentation and is how the
Group’s operating performance is reviewed by management.