Vodafone 2015 Annual Report Download - page 178
Download and view the complete annual report
Please find page 178 of the 2015 Vodafone annual report below. You can navigate through the pages in the report by either clicking on the pages listed below, or by using the keyword search tool below to find specific information within the annual report.-
 1
1 -
2
-
3
-
4
-
5
-
6
-
7
-
8
-
9
-
10
-
11
-
12
-
13
-
14
-
15
-
16
-
17
-
18
-
19
-
20
-
21
-
22
-
23
-
24
-
25
-
26
-
27
-
28
-
29
-
30
-
31
-
32
-
33
-
34
-
35
-
36
-
37
-
38
-
39
-
40
-
41
-
42
-
43
-
44
-
45
-
46
-
47
-
48
-
49
-
50
-
51
-
52
-
53
-
54
-
55
-
56
-
57
-
58
-
59
-
60
-
61
-
62
-
63
-
64
-
65
-
66
-
67
-
68
-
69
-
70
-
71
-
72
-
73
-
74
-
75
-
76
-
77
-
78
-
79
-
80
-
81
-
82
-
83
-
84
-
85
-
86
-
87
-
88
-
89
-
90
-
91
-
92
-
93
-
94
-
95
-
96
-
97
-
98
-
99
-
100
-
101
-
102
-
103
-
104
-
105
-
106
-
107
-
108
-
109
-
110
-
111
-
112
-
113
-
114
-
115
-
116
-
117
-
118
-
119
-
120
-
121
-
122
-
123
-
124
-
125
-
126
-
127
-
128
-
129
-
130
-
131
-
132
-
133
-
134
-
135
-
136
-
137
-
138
-
139
-
140
-
141
-
142
-
143
-
144
-
145
-
146
-
147
-
148
-
149
-
150
-
151
-
152
-
153
-
154
-
155
-
156
-
157
-
158
-
159
-
160
-
161
-
162
-
163
-
164
-
165
-
166
-
167
-
 168
168 -
 169
169 -
 170
170 -
 171
171 -
 172
172 -
 173
173 -
 174
174 -
 175
175 -
 176
176 -
 177
177 -
 178
178 -
 179
179 -
 180
180 -
 181
181 -
 182
182 -
 183
183 -
 184
184 -
 185
185 -
 186
186 -
 187
187 -
 188
188 -
189
-
190
-
191
-
192
-
193
-
194
-
195
-
196
-
197
-
198
-
199
-
200
-
201
-
202
-
203
-
204
-
205
-
206
-
207
-
208
-
209
-
210
-
211
-
212
-
213
-
214
-
215
-
216
 |
 |

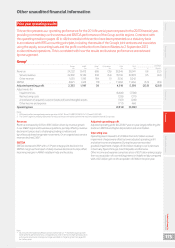
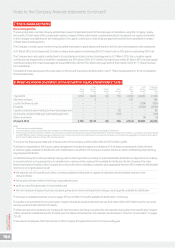
Prior year operating results (continued)
Europe
% change
Germany
£m
Italy1
£m
UK
£m
Spain
£m
Other Europe
£m
Eliminations
£m
Europe
£m £Organic
Year ended 31 March 2014
Revenue 8,272 522 6,427 3,518 5,526 (43) 24,222 1.4 (8.3)
Service revenue 7, 7 39 465 6,095 3,230 5 ,10 3 (40) 22,592 2.0 (7.7)
Other revenue 533 57 332 288 423 (3) 1,630 (5.7) (15.3)
EBITDA 2,698 182 1,418 787 1,736 –6,821 (5.0) (16.9)
Adjusted operating prot 918 371 187 181 676 –2,333 (37.6) (41.5)
EBITDA margin 32.6% 34.9% 22.1% 22.4% 31.4% 28.2%
Year ended 31 March 2013
Revenue 7, 8 57 –5,150 3,904 7,114 (141) 23,884 (3.4) (4.3)
Service revenue 7, 2 75 –4,782 3,629 6 ,610 (140) 22,156 (3.1) (4.2)
Other revenue 582 –368 275 504 (1) 1,728 (6.2) (4.9)
EBITDA 2,831 –1,210 1,021 2 ,121 –7,18 3 (6.7) (4.4)
Adjusted operating prot 1,401 739 303 421 878 –3, 74 2 (19.8) (14.2)
EBITDA margin 36.0% 0.0% 23.5% 26.2% 29.8% 30.1%
Note:
1 Adjusted operating prot for the year ended 31 March 2013 of £739 million in respect of Italy represents the Group’s share of the net result of Vodafone Italy.
Revenue increased 1.4%, including a 2.4 percentage point favourable
impact from foreign exchange rate movements and a 7.3 percentage
point positive impact from M&A and other activity. On an organic basis
service revenue declined 7.7%*, driven by challenging macroeconomic
conditions in many markets, increased competition and the
impact of MTR cuts, partially offset by continued growth of mobile
in-bundle revenue.
EBITDA decreased 5.0%, including a 2.6 percentage point favourable
impact from foreign exchange rate movements and a 9.3 percentage
point positive impact from M&A and other activity. On an organic basis
EBITDA decreased 16.9%*, resulting from a reduction in service revenue
in most markets and higher customer investment, partially offset
by efciency in operating costs.
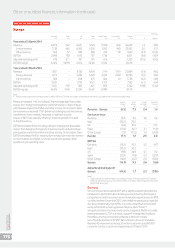
Organic
change*
%
Other
activity
pps
Foreign
exchange
pps
Reported
change
%
Revenue – Europe (8.3) 7.3 2.4 1.4
Service revenue
Germany (6.2) 9.0 3.6 6.4
Italy1(20.2) 20.2 – –
UK (4.4) 31.9 –2 7. 5
Spain (13.4) (0.7) 3 .1 (11.0)
Other Europe (7.1) (17.5) 1.8 (22.8)
Europe (7.7) 7.2 2.5 2.0
EBITDA
Germany (18.2) 10.2 3.3 (4.7)
Italy1(30.3) 30.3 – –
UK (9.8) 26.9 0.1 17. 2
Spain (23.9) (1.8) 2.8 (22.9)
Other Europe (14.0) (6.2) 2.0 (18.2)
Europe (16.9) 9.3 2.6 (5.0)
Adjusted operating prot
Europe (41.5) 1.7 2.2 (37.6)
Note:
1 Organic growth for Vodafone Italy only includes its results for the period from 21 February
2014, the date the Group acquired a 100% interest, to 31 March 2014 compared to the same
period the previous year.
Germany
Service revenue decreased 6.2%*, with a slightly improving trend in Q4
compared to Q3. Performance for the year was driven by intense price
competition in both the consumer and enterprise segments and an MTR
cut effective from December 2012, with Vodafone particularly impacted
due to our traditionally high ARPU. In a more competitive environment
we launched both a more aggressive 3G price plan (“Smart”)
and pushed otelo in the entry-level contract segment. Mobile in-bundle
revenue increased 2.7%* as a result of growth in integrated Vodafone
Red offers, which was more than offset by a decline in mobile
out-of-bundle revenue of 22.6%*. We continue to focus on Vodafone
Red and 4G where we had nearly 3.0 million customers and 891,000
consumer contract customers respectively at 31 March 2014.
Vodafone Group Plc
Annual Report 2015
176
Other unaudited nancial information (continued)