Vodafone 2015 Annual Report Download - page 129
Download and view the complete annual report
Please find page 129 of the 2015 Vodafone annual report below. You can navigate through the pages in the report by either clicking on the pages listed below, or by using the keyword search tool below to find specific information within the annual report.-
 1
1 -
2
-
3
-
4
-
5
-
6
-
7
-
8
-
9
-
10
-
11
-
12
-
13
-
14
-
15
-
16
-
17
-
18
-
19
-
20
-
21
-
22
-
23
-
24
-
25
-
26
-
27
-
28
-
29
-
30
-
31
-
32
-
33
-
34
-
35
-
36
-
37
-
38
-
39
-
40
-
41
-
42
-
43
-
44
-
45
-
46
-
47
-
48
-
49
-
50
-
51
-
52
-
53
-
54
-
55
-
56
-
57
-
58
-
59
-
60
-
61
-
62
-
63
-
64
-
65
-
66
-
67
-
68
-
69
-
70
-
71
-
72
-
73
-
74
-
75
-
76
-
77
-
78
-
79
-
80
-
81
-
82
-
83
-
84
-
85
-
86
-
87
-
88
-
89
-
90
-
91
-
92
-
93
-
94
-
95
-
96
-
97
-
98
-
99
-
100
-
101
-
102
-
103
-
104
-
105
-
106
-
107
-
108
-
109
-
110
-
111
-
112
-
113
-
114
-
115
-
116
-
117
-
118
-
 119
119 -
 120
120 -
 121
121 -
 122
122 -
 123
123 -
 124
124 -
 125
125 -
 126
126 -
 127
127 -
 128
128 -
 129
129 -
 130
130 -
 131
131 -
 132
132 -
 133
133 -
 134
134 -
 135
135 -
 136
136 -
 137
137 -
 138
138 -
 139
139 -
140
-
141
-
142
-
143
-
144
-
145
-
146
-
147
-
148
-
149
-
150
-
151
-
152
-
153
-
154
-
155
-
156
-
157
-
158
-
159
-
160
-
161
-
162
-
163
-
164
-
165
-
166
-
167
-
168
-
169
-
170
-
171
-
172
-
173
-
174
-
175
-
176
-
177
-
178
-
179
-
180
-
181
-
182
-
183
-
184
-
185
-
186
-
187
-
188
-
189
-
190
-
191
-
192
-
193
-
194
-
195
-
196
-
197
-
198
-
199
-
200
-
201
-
202
-
203
-
204
-
205
-
206
-
207
-
208
-
209
-
210
-
211
-
212
-
213
-
214
-
215
-
216
 |
 |

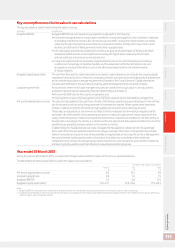
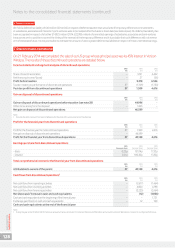
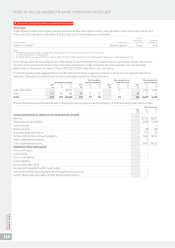
At 31 March 2015, the gross amount and expiry dates of losses available for carry forward are as follows:
Expiring Expiring
within within
5 years 6–10 years Unlimited Total
£m £m £m £m
Losses for which a deferred tax asset is recognised 104 64 87,246 87,414
Losses for which no deferred tax is recognised 1,124 543 16,084 17,751
1,228 607 103,330 105,165
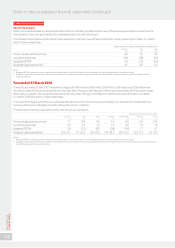
At 31 March 2014, the gross amount and expiry dates of losses available for carry forward are as follows:
Expiring Expiring
within within
5 years 6–10 years Unlimited Total
£m £m £m £m
Losses for which a deferred tax asset is recognised 274 461 79,115 79,850
Losses for which no deferred tax is recognised 1,281 519 26,318 28,118
1,555 980 105,433 107,968
Deferred tax assets on losses in Luxembourg
Included in the table above are losses of £70,576 million (2014: £73,734 million) that have arisen in Luxembourg companies, principally as a result
of revaluations of those companies’ investments for local GAAP purposes. These losses do not expire.
A deferred tax asset of £20,755 million (2014: £18,150 million) has been recognised in respect of these losses as we conclude it is probable that the
Luxembourg entities will continue to generate taxable prots in the future against which we can utilise these losses. The Luxembourg companies
income is derived from the Group’s internal nancing and procurement and roaming activities. We have reviewed the latest forecasts for the
Luxembourg companies, including their ability to continue to generate income beyond the forecast period under the tax laws substantively enacted
at the balance sheet date. The assessment also considered whether the structure of the Group would continue to allow the generation of taxable
income. Based on this, we conclude that it is probable that the Luxembourg companies will continue to generate taxable income in the future.
Based on the current forecasts the losses will be fully utilised over the next 55 to 65 years. A 5%–10% change in the forecast income in Luxembourg
would change the period over which the losses will be fully utilised by between two and four years. Any future changes in tax law or the structure
of the Group could have a signicant effect on the use of losses, including the period over which the losses are utilised.
During the current year we recognised an additional deferred tax asset of £3,341 million relating to the historic tax losses in Luxembourg
as a consequence of the nancing arrangements for the acquisition of Grupo Corporativo Ono, S.A. We also recognised an additional deferred tax
asset of £2,127 million arising from the revaluation of investments based upon the local GAAP nancial statements.
We also have £7,642 million (2014: £7,642 million) of Luxembourg losses in a former Cable & Wireless Worldwide Group company, for which
no deferred tax asset has been recognised as it is uncertain whether these losses will be utilised.
Deferred tax assets on losses in Germany
The Group has tax losses of £13,600 million (2014: £15,290 million) in Germany arising on the write down of investments in Germany in 2000.
The losses are available to use against both German federal and trade tax liabilities and they do not expire.
A deferred tax asset of £2,086 million (2014: £2,344 million) has been recognised in respect of these losses as we conclude it is probable that the
German business will continue to generate taxable prots in the future against which we can utilise these losses. We have reviewed the latest
forecasts for the German business which incorporate the unsystematic risks of operating in the telecommunications business (see pages 32 to 37).
In the period beyond the ve year forecast, we have reviewed the prots inherent in the value in use calculations and based on these and our
expectations for the German business, we believe it is probable the German losses will be fully utilised. Based on the current forecasts the losses will
be fully utilised over the next 10 to 15 years. A 5%–10% change in the prots of the German business would change the period over which the losses
will be fully utilised by up to one year.
The recognition of the additional deferred tax assets in Luxembourg and Germany in the year ended 31 March 2014 was triggered by the agreement
to dispose of the US group whose principal asset was its 45% interest in Verizon Wireless, which removed signicant uncertainty over the future
structure of the Group including the continuation of future income streams in Luxembourg and the availability of the losses in Germany.
Other tax losses
During the year, the Group acquired Grupo Corporativo Ono, S.A. and which had tax losses of £2,375 million in Spain and which are available to offset
against the future prots of the Spanish business. The losses do not expire.
A deferred tax asset of £603 million (2014: £nil) has been recognised in respect of these losses as we conclude it is probable that the Spanish
business will continue to generate taxable prots in the future against which we can utilise these losses. We have reviewed the latest forecasts for
the Spanish business which incorporate the unsystematic risks of operating in the telecommunications business (see pages 32 to 37). In the period
beyond the ve year forecast, we have reviewed the prots inherent in the value in use calculations and based on these and our expectations for the
Spanish business, we believe it is probable the losses will be fully utilised. Based on the current forecasts the losses will be fully utilised over the next
eight to ten years. A 5%–10% change in the prots of the Spanish business would not signicantly alter the utilisation period.
We have losses amounting to £6,735 million (2014: £6,651 million) in respect of UK subsidiaries which are only available for offset against future
capital gains and since it is uncertain whether these losses will be utilised, no deferred tax asset has been recognised. We recognised a deferred tax
asset (2014: £442 million) of these losses in the prior year.
The remaining losses relate to a number of other jurisdictions across the Group. There are also £310 million (2014: £339 million) of unrecognised
other temporary differences.
Overview Strategy review Performance Governance Financials Additional information Vodafone Group Plc
Annual Report 2015
127