Vodafone 2015 Annual Report Download - page 124
Download and view the complete annual report
Please find page 124 of the 2015 Vodafone annual report below. You can navigate through the pages in the report by either clicking on the pages listed below, or by using the keyword search tool below to find specific information within the annual report.-
 1
1 -
2
-
3
-
4
-
5
-
6
-
7
-
8
-
9
-
10
-
11
-
12
-
13
-
14
-
15
-
16
-
17
-
18
-
19
-
20
-
21
-
22
-
23
-
24
-
25
-
26
-
27
-
28
-
29
-
30
-
31
-
32
-
33
-
34
-
35
-
36
-
37
-
38
-
39
-
40
-
41
-
42
-
43
-
44
-
45
-
46
-
47
-
48
-
49
-
50
-
51
-
52
-
53
-
54
-
55
-
56
-
57
-
58
-
59
-
60
-
61
-
62
-
63
-
64
-
65
-
66
-
67
-
68
-
69
-
70
-
71
-
72
-
73
-
74
-
75
-
76
-
77
-
78
-
79
-
80
-
81
-
82
-
83
-
84
-
85
-
86
-
87
-
88
-
89
-
90
-
91
-
92
-
93
-
94
-
95
-
96
-
97
-
98
-
99
-
100
-
101
-
102
-
103
-
104
-
105
-
106
-
107
-
108
-
109
-
110
-
111
-
112
-
113
-
 114
114 -
 115
115 -
 116
116 -
 117
117 -
 118
118 -
 119
119 -
 120
120 -
 121
121 -
 122
122 -
 123
123 -
 124
124 -
 125
125 -
 126
126 -
 127
127 -
 128
128 -
 129
129 -
 130
130 -
 131
131 -
 132
132 -
 133
133 -
 134
134 -
135
-
136
-
137
-
138
-
139
-
140
-
141
-
142
-
143
-
144
-
145
-
146
-
147
-
148
-
149
-
150
-
151
-
152
-
153
-
154
-
155
-
156
-
157
-
158
-
159
-
160
-
161
-
162
-
163
-
164
-
165
-
166
-
167
-
168
-
169
-
170
-
171
-
172
-
173
-
174
-
175
-
176
-
177
-
178
-
179
-
180
-
181
-
182
-
183
-
184
-
185
-
186
-
187
-
188
-
189
-
190
-
191
-
192
-
193
-
194
-
195
-
196
-
197
-
198
-
199
-
200
-
201
-
202
-
203
-
204
-
205
-
206
-
207
-
208
-
209
-
210
-
211
-
212
-
213
-
214
-
215
-
216
 |
 |

Notes to the consolidated nancial statements (continued)
4. Impairment losses (continued)
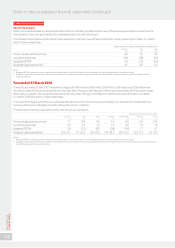
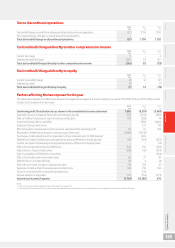
Sensitivity analysis
Other than as disclosed below, management believed that no reasonably possible change in any of the above key assumptions would cause the
carrying value of any cash-generating unit to exceed its recoverable amount.
The estimated recoverable amounts of the Group’s operations in Italy, Spain, Portugal and Greece were equal to, or not materially greater than, their
carrying values; consequently, any adverse change in key assumptions would, in isolation, have caused a further impairment loss to be recognised.
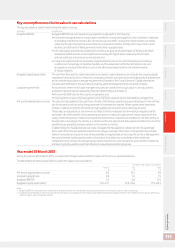
The estimated recoverable amounts of the Group’s operations in Germany and Romania exceeded their carrying values by approximately
£1,034 million and £184 million respectively.
Change required for carrying value
to equal the recoverable amount
Germany Romania
pps pps
Pre-tax risk adjusted discount rate 0.4 1.0
Long-term growth rate (0.5) (1.2)
Budgeted EBITDA1(0.7) (1.7)
Budgeted capital expenditure21.1 2.8
Notes:
1 Budgeted EBITDA is expressed as the compound annual growth rates in the initial ve years for all cash-generating units of the plans used for impairment testing.
2 Budgeted capital expenditure is expressed as the range of capital expenditure as a percentage of revenue in the initial ve years for all cash-generating units of the plans used for
impairment testing.
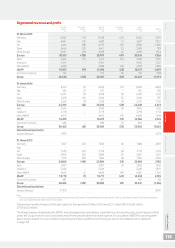
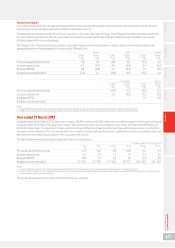
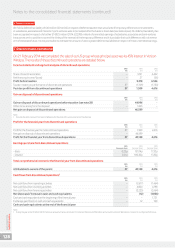
The changes in the following table to assumptions used in the impairment review would have, in isolation, led to an (increase)/decrease to the
aggregate impairment loss recognised in the year ended 31 March 2013:
Italy Spain Portugal
Increase Decrease Increase Decrease Increase Decrease
by 2pps by 2pps by 2pps by 2pps by 2pps by 2pps
£bn £bn £bn £bn £bn £bn
Pre-tax risk adjusted discount rate (1.4) 1.8 (0.7) –(0.3) –
Long-term growth rate 1.8 (1.3) –(0.7) –(0.3)
Budgeted EBITDA10.5 (0.5) –(0.1) –(0.1)
Budgeted capital expenditure2(0.9) 0.9 (0.6) –(0.2) –
Notes:
1 Budgeted EBITDA is expressed as the compound annual growth rates in the initial ve years for all cash-generating units of the plans used for impairment testing.
2 Budgeted capital expenditure is expressed as a percentage of revenue in the initial ve years for all cash-generating units of the plans used for impairment testing.
Vodafone Group Plc
Annual Report 2015
122