Vodafone 2015 Annual Report Download - page 158
Download and view the complete annual report
Please find page 158 of the 2015 Vodafone annual report below. You can navigate through the pages in the report by either clicking on the pages listed below, or by using the keyword search tool below to find specific information within the annual report.-
 1
1 -
2
-
3
-
4
-
5
-
6
-
7
-
8
-
9
-
10
-
11
-
12
-
13
-
14
-
15
-
16
-
17
-
18
-
19
-
20
-
21
-
22
-
23
-
24
-
25
-
26
-
27
-
28
-
29
-
30
-
31
-
32
-
33
-
34
-
35
-
36
-
37
-
38
-
39
-
40
-
41
-
42
-
43
-
44
-
45
-
46
-
47
-
48
-
49
-
50
-
51
-
52
-
53
-
54
-
55
-
56
-
57
-
58
-
59
-
60
-
61
-
62
-
63
-
64
-
65
-
66
-
67
-
68
-
69
-
70
-
71
-
72
-
73
-
74
-
75
-
76
-
77
-
78
-
79
-
80
-
81
-
82
-
83
-
84
-
85
-
86
-
87
-
88
-
89
-
90
-
91
-
92
-
93
-
94
-
95
-
96
-
97
-
98
-
99
-
100
-
101
-
102
-
103
-
104
-
105
-
106
-
107
-
108
-
109
-
110
-
111
-
112
-
113
-
114
-
115
-
116
-
117
-
118
-
119
-
120
-
121
-
122
-
123
-
124
-
125
-
126
-
127
-
128
-
129
-
130
-
131
-
132
-
133
-
134
-
135
-
136
-
137
-
138
-
139
-
140
-
141
-
142
-
143
-
144
-
145
-
146
-
147
-
 148
148 -
 149
149 -
 150
150 -
 151
151 -
 152
152 -
 153
153 -
 154
154 -
 155
155 -
 156
156 -
 157
157 -
 158
158 -
 159
159 -
 160
160 -
 161
161 -
 162
162 -
 163
163 -
 164
164 -
 165
165 -
 166
166 -
 167
167 -
 168
168 -
169
-
170
-
171
-
172
-
173
-
174
-
175
-
176
-
177
-
178
-
179
-
180
-
181
-
182
-
183
-
184
-
185
-
186
-
187
-
188
-
189
-
190
-
191
-
192
-
193
-
194
-
195
-
196
-
197
-
198
-
199
-
200
-
201
-
202
-
203
-
204
-
205
-
206
-
207
-
208
-
209
-
210
-
211
-
212
-
213
-
214
-
215
-
216
 |
 |
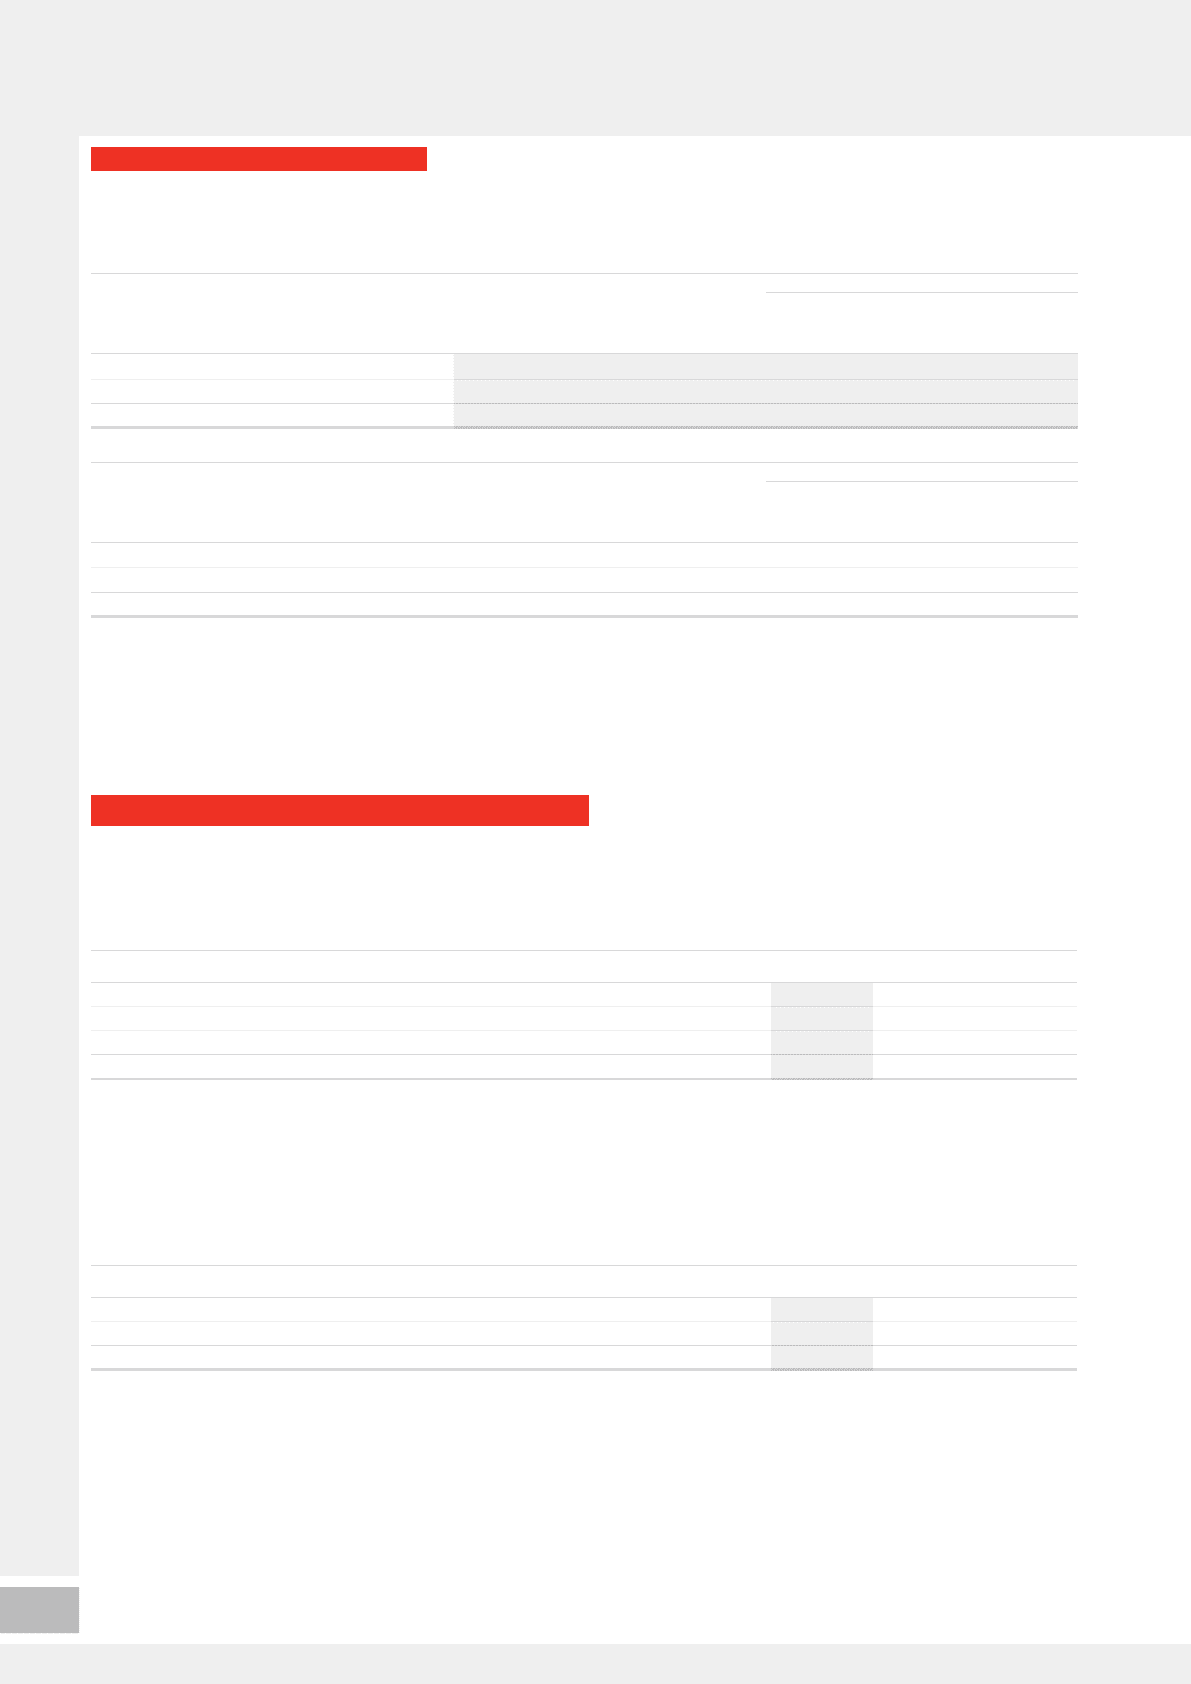
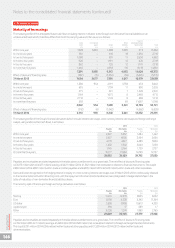
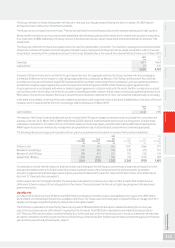
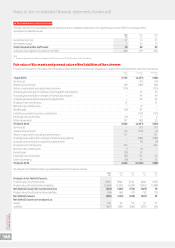
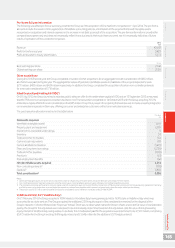
23. Capital and nancial risk management (continued)
Net nancial instruments
The table below shows the Group’s nancial assets and liabilities that are subject to offset in the balance sheet and the impact of enforceable master
netting or similar agreements.
At 31 March 2015
Related amounts not set off in the balance sheet
Gross amount Amount set off
Amounts
presented in
balance sheet
Right of set off
with derivative
counterparties Cash collateral Net amount
£m £m £m £m £m £m
Derivative nancial assets 4,005 – 4,005 (726) (2,542) 737
Derivative nancial liabilities (984) – (984) 726 30 (228)
Total 3,021 – 3,021 – (2,512) 509
At 31 March 2014
Related amounts not set off in the balance sheet
Gross amount Amount set off
Amounts
presented in
balance sheet
Right of set off
with derivative
counterparties Cash collateral Net amount
£m £m £m £m £m £m
Derivative nancial assets 2,456 – 2,456 (678) (1,185) 593
Derivative nancial liabilities (881) – (881) 678 130 (73)
Total 1,575 – 1,575 – (1,055) 520
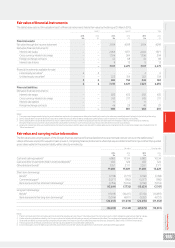
Financial assets and liabilities are offset and the amount reported in the consolidated balance sheet when there is a legally enforceable right
to offset the recognised amounts and there is an intention to settle on a net basis or realise the asset and settle the liability simultaneously.
Derivative nancial instruments that do not meet the criteria for offset could be settled net in certain circumstances under ISDA (International Swaps
and Derivatives Association) agreements where each party has the option to settle amounts on a net basis in the event of default from the other.
Collateral may be offset and net settled against derivative nancial instruments in the event of default by either party. The aforementioned collateral
balances are recorded in “other short-term investments” or “short-term debt”respectively.
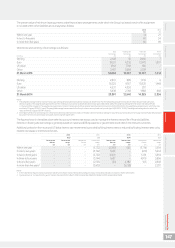
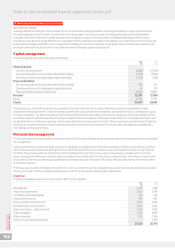
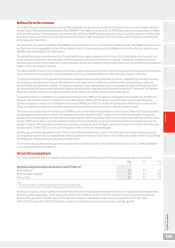
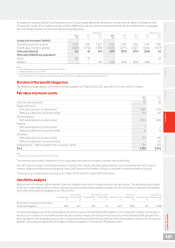
24. Directors and key management compensation
This note details the total amounts earned by the Company’s Directors and members of the Executive Committee.
Directors
Aggregate emoluments of the Directors of the Company were as follows:
2015 2014 2013
£m £m £m
Salaries and fees 4 4 5
Incentive schemes 32 2
Other benets11 1 1
878
Note:
1 Includes the value of the cash allowance taken by some individuals in lieu of pension contributions.
The aggregate gross pre-tax gain made on the exercise of share options in the year ended 31 March 2015 by Directors who served during the year
was £nil (2014: £4 million; 2013: £2 million).
Key management compensation
Aggregate compensation for key management, being the Directors and members of the Executive Committee, was as follows:
2015 2014 2013
£m £m £m
Short-term employee benets 18 17 17
Share-based payments 18 21 23
36 38 40
Notes to the consolidated nancial statements (continued)
Vodafone Group Plc
Annual Report 2015
156