Vodafone 2015 Annual Report Download - page 145
Download and view the complete annual report
Please find page 145 of the 2015 Vodafone annual report below. You can navigate through the pages in the report by either clicking on the pages listed below, or by using the keyword search tool below to find specific information within the annual report.-
 1
1 -
2
-
3
-
4
-
5
-
6
-
7
-
8
-
9
-
10
-
11
-
12
-
13
-
14
-
15
-
16
-
17
-
18
-
19
-
20
-
21
-
22
-
23
-
24
-
25
-
26
-
27
-
28
-
29
-
30
-
31
-
32
-
33
-
34
-
35
-
36
-
37
-
38
-
39
-
40
-
41
-
42
-
43
-
44
-
45
-
46
-
47
-
48
-
49
-
50
-
51
-
52
-
53
-
54
-
55
-
56
-
57
-
58
-
59
-
60
-
61
-
62
-
63
-
64
-
65
-
66
-
67
-
68
-
69
-
70
-
71
-
72
-
73
-
74
-
75
-
76
-
77
-
78
-
79
-
80
-
81
-
82
-
83
-
84
-
85
-
86
-
87
-
88
-
89
-
90
-
91
-
92
-
93
-
94
-
95
-
96
-
97
-
98
-
99
-
100
-
101
-
102
-
103
-
104
-
105
-
106
-
107
-
108
-
109
-
110
-
111
-
112
-
113
-
114
-
115
-
116
-
117
-
118
-
119
-
120
-
121
-
122
-
123
-
124
-
125
-
126
-
127
-
128
-
129
-
130
-
131
-
132
-
133
-
134
-
 135
135 -
 136
136 -
 137
137 -
 138
138 -
 139
139 -
 140
140 -
 141
141 -
 142
142 -
 143
143 -
 144
144 -
 145
145 -
 146
146 -
 147
147 -
 148
148 -
 149
149 -
 150
150 -
 151
151 -
 152
152 -
 153
153 -
 154
154 -
 155
155 -
156
-
157
-
158
-
159
-
160
-
161
-
162
-
163
-
164
-
165
-
166
-
167
-
168
-
169
-
170
-
171
-
172
-
173
-
174
-
175
-
176
-
177
-
178
-
179
-
180
-
181
-
182
-
183
-
184
-
185
-
186
-
187
-
188
-
189
-
190
-
191
-
192
-
193
-
194
-
195
-
196
-
197
-
198
-
199
-
200
-
201
-
202
-
203
-
204
-
205
-
206
-
207
-
208
-
209
-
210
-
211
-
212
-
213
-
214
-
215
-
216
 |
 |

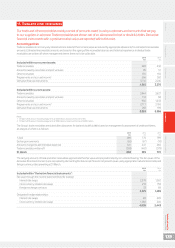
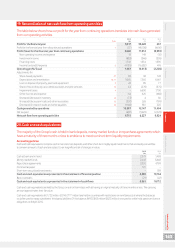
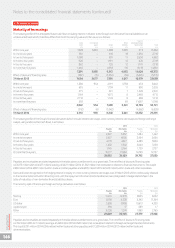
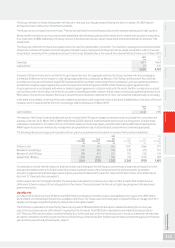
19. Reconciliation of net cash ow from operating activities
The table below shows how our prot for the year from continuing operations translates into cash ows generated
from our operating activities.
2015 2014 2013
Notes £m £m £m
Prot for the nancial year 5,917 59,420 657
Prot for the nancial year from discontinued operations 7(57) (48,108) (4,616)
Prot/(loss) for the nancial year from continuing operations 5,860 11,312 (3,959)
Non-operating income and expense 19 149 (10)
Investment income (883) (346) (305)
Financing costs 1,736 1,554 1,596
Income tax (credit)/expense 6(4,765) (16,582) 476
Operating prot/(loss) 1,967 (3,913) (2,202)
Adjustments for:
Share-based payments 27 88 92 124
Depreciation and amortisation 10, 11 9,565 7,560 6,661
Loss on disposal of property, plant and equipment 349 85 77
Share of result of equity accounted associates and joint ventures 12 63 (278) (575)
Impairment losses 4–6,600 7,70 0
Other income and expense 114 620 (468)
(Increase)/decrease in inventory 14 (73) 456
(Increase)/decrease in trade and other receivables 15 (230) 526 (199)
(Decrease)/increase in trade and other payables 16 (1,146) 851 320
Cash generated by operations 10,397 12,147 11,494
Net tax paid (682) (5,920) (2,670)
Net cash ow from operating activities 9,715 6,227 8,824
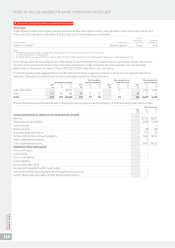
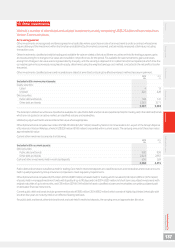
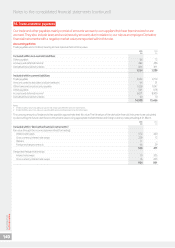
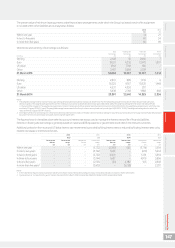
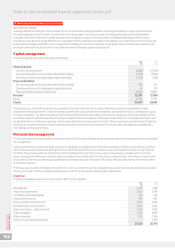
20. Cash and cash equivalents
The majority of the Group’s cash is held in bank deposits, money market funds or in repurchase agreements which
have a maturity of three months or less to enable us to meet our short-term liquidity requirements.
Accounting policies
Cash and cash equivalents comprise cash in hand and call deposits, and other short-term highly liquid investments that are readily convertible
to a known amount of cash and are subject to an insignicant risk of changes in value.
2015 2014
£m £m
Cash at bank and in hand 2,379 1,498
Money market funds 2,402 3,648
Repurchase agreements 2,000 4,799
Commercial paper 101 –
Short-term securitised investments –189
Cash and cash equivalents as presented in the statement of nancial position 6,882 10,134
Bank overdrafts (21) (22)
Cash and cash equivalents as presented in the statement of cash ows 6,861 10,112
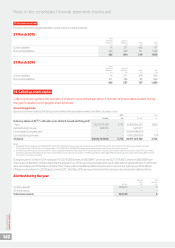
Cash and cash equivalents are held by the Group on a short-term basis with all having an original maturity of three months or less. The carrying
amount approximates their fair value.
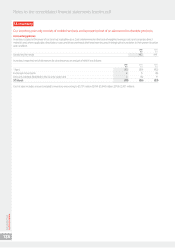
Cash and cash equivalents of £1,722 million (2014: £777 million) are held in countries with restrictions on remittances but where the balances
could be used to repay subsidiaries’ third party liabilities. Of this balance, INR 57,863 million (£623 million) was used to settle India spectrum licence
obligations on 8 April 2015.
Overview Strategy review Performance Governance Financials Additional information Vodafone Group Plc
Annual Report 2015
143