Vodafone 2015 Annual Report Download - page 150
Download and view the complete annual report
Please find page 150 of the 2015 Vodafone annual report below. You can navigate through the pages in the report by either clicking on the pages listed below, or by using the keyword search tool below to find specific information within the annual report.-
 1
1 -
2
-
3
-
4
-
5
-
6
-
7
-
8
-
9
-
10
-
11
-
12
-
13
-
14
-
15
-
16
-
17
-
18
-
19
-
20
-
21
-
22
-
23
-
24
-
25
-
26
-
27
-
28
-
29
-
30
-
31
-
32
-
33
-
34
-
35
-
36
-
37
-
38
-
39
-
40
-
41
-
42
-
43
-
44
-
45
-
46
-
47
-
48
-
49
-
50
-
51
-
52
-
53
-
54
-
55
-
56
-
57
-
58
-
59
-
60
-
61
-
62
-
63
-
64
-
65
-
66
-
67
-
68
-
69
-
70
-
71
-
72
-
73
-
74
-
75
-
76
-
77
-
78
-
79
-
80
-
81
-
82
-
83
-
84
-
85
-
86
-
87
-
88
-
89
-
90
-
91
-
92
-
93
-
94
-
95
-
96
-
97
-
98
-
99
-
100
-
101
-
102
-
103
-
104
-
105
-
106
-
107
-
108
-
109
-
110
-
111
-
112
-
113
-
114
-
115
-
116
-
117
-
118
-
119
-
120
-
121
-
122
-
123
-
124
-
125
-
126
-
127
-
128
-
129
-
130
-
131
-
132
-
133
-
134
-
135
-
136
-
137
-
138
-
139
-
 140
140 -
 141
141 -
 142
142 -
 143
143 -
 144
144 -
 145
145 -
 146
146 -
 147
147 -
 148
148 -
 149
149 -
 150
150 -
 151
151 -
 152
152 -
 153
153 -
 154
154 -
 155
155 -
 156
156 -
 157
157 -
 158
158 -
 159
159 -
 160
160 -
161
-
162
-
163
-
164
-
165
-
166
-
167
-
168
-
169
-
170
-
171
-
172
-
173
-
174
-
175
-
176
-
177
-
178
-
179
-
180
-
181
-
182
-
183
-
184
-
185
-
186
-
187
-
188
-
189
-
190
-
191
-
192
-
193
-
194
-
195
-
196
-
197
-
198
-
199
-
200
-
201
-
202
-
203
-
204
-
205
-
206
-
207
-
208
-
209
-
210
-
211
-
212
-
213
-
214
-
215
-
216
 |
 |

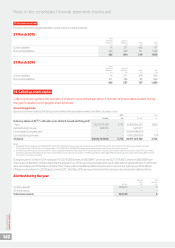
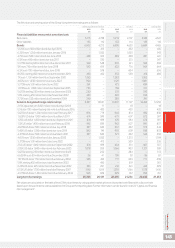
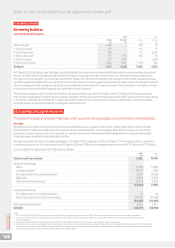
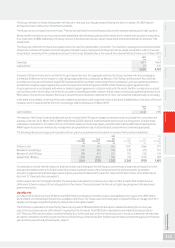
21. Borrowings (continued)
Borrowing facilities
Committed facilities expiry
2015 2014
Drawn Undrawn Drawn Undrawn
£m £m £m £m
Within one year 1,065 – 590 70
In one to two years 431 – 451 13
In two to three years 736 – 171 2,643
In three to four years 757 573 565 35
In four to ve years 317 2,790 –3,188
In more than ve years 1,065 3,257 1,728 582
31 March 4,371 6,620 3,505 6,531
At 31 March 2015, the Group’s most signicant committed facilities comprised two revolving credit facilities which remained undrawn throughout
the year of US$3.9 billion (£2.6 billion) and €3.9 billion (£2.8 billion) maturing in ve years. Under the terms of these bank facilities, lenders have
the right, but not the obligation, to cancel their commitment 30 days from the date of notication of a change of control of the Company and have
outstanding advances repaid on the last day of the current interest period. The facility agreements provide for certain structural changes that do not
affect the obligations of the Company to be specically excluded from the denition of a change of control. This is in addition to the rights of lenders
to cancel their commitment if the Company has committed an event of default.
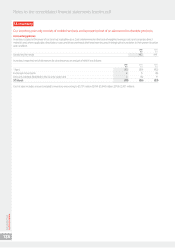
The terms and conditions of the Group’s drawn facilities obtained in relation to projects in its Italian, German, Turkish and Romanian operations
of €1.6 billion in aggregate (£1.2 billion) and the undrawn facilities in the Group’s UK and Irish operations totalling £0.5 billion and the undrawn facility
in the German operation of €0.4 billion (£0.3 million) are similar to those of the US dollar and euro revolving credit facilities. Further information
on these facilities can be found in note 22 “Liquidity and capital resources”.
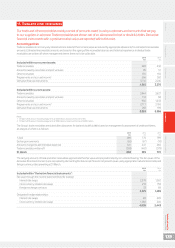
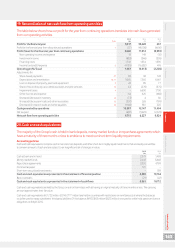
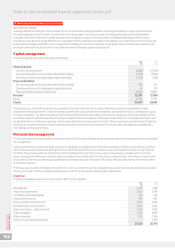
22. Liquidity and capital resources
This section includes an analysis of net debt, which we use to manage capital, and committed borrowing facilities.
Net debt
Net debt was £22.3 billion at 31 March 2015 and includes liabilities for amounts payable under the domination agreement in relation to Kabel
Deutschland (£1.3 billion) and deferred spectrum licence costs in India (£1.8 billion). This increased by £8.5 billion in the year as a result of the
acquisition of Grupo Corporativo Ono, S.A., payments for spectrum licences and equity shareholders dividends which outweighed favourable
foreign exchange movements and positive free cash ow.
Net debt represented 35.1% of our market capitalisation at 31 March 2015 compared to 23.5% at 31 March 2014. Average net debt at month end
accounting dates over the 12 month period ended 31 March 2015 was £19.8 billion and ranged between net debt of £14.1 billion and £22.9 billion.
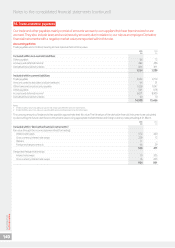
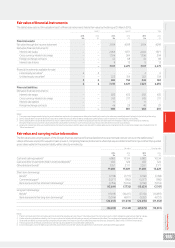
Our consolidated net debt position at 31 March was as follows:
2015 2014
£m £m
Cash and cash equivalents 6,882 10,134
Short-term borrowings
Bonds (1,786) (1,783)
Commercial paper1(5,077) (950)
Put options over non-controlling interests2(1,307) (2,330)
Bank loans (1,876) (1,263)
Other short-term borrowings3(2,577) (1,421)
(12,623) (7,747)
Long-term borrowings
Put options over non-controlling interests (7) (6)
Bonds, loans and other long-term borrowings (22,428) (21,448)
(22,435) (21,454)
Other nancial instruments45,905 5,367
Net debt (22,271) (13,700)
Notes:
1 At 31 March 2015 US$3,321 million was drawn under the US commercial paper programme and €3,928 million was drawn under the euro commercial paper programme.
2 Includes a £1.3 billion (2014: £1.4 billion) liability for payments due to holders of the equity shares in Kabel Deutschland AG under the terms of a domination and prot and loss
transfer agreement.
3 At 31 March 2015 the amount includes £2,542 million (2014: £1,185 million) in relation to cash received under collateral support agreements.
4 Comprises mark-to-market adjustments on derivative nancial instruments which are included as a component of trade and other receivables (2015: £4,005 million; 2014: £2,443 million)
and trade and other payables (2015: £984 million; 2014: £881 million) and short-term investments primarily in index linked government bonds and managed investment funds included
as a component of other investments (2015: £2,884 million; 2014: £3,805 million).
Notes to the consolidated nancial statements (continued)
Vodafone Group Plc
Annual Report 2015
148