Vodafone 2015 Annual Report Download - page 21
Download and view the complete annual report
Please find page 21 of the 2015 Vodafone annual report below. You can navigate through the pages in the report by either clicking on the pages listed below, or by using the keyword search tool below to find specific information within the annual report.-
 1
1 -
2
-
3
-
4
-
5
-
6
-
7
-
8
-
9
-
10
-
 11
11 -
 12
12 -
 13
13 -
 14
14 -
 15
15 -
 16
16 -
 17
17 -
 18
18 -
 19
19 -
 20
20 -
 21
21 -
 22
22 -
 23
23 -
 24
24 -
 25
25 -
 26
26 -
 27
27 -
 28
28 -
 29
29 -
 30
30 -
 31
31 -
32
-
33
-
34
-
35
-
36
-
37
-
38
-
39
-
40
-
41
-
42
-
43
-
44
-
45
-
46
-
47
-
48
-
49
-
50
-
51
-
52
-
53
-
54
-
55
-
56
-
57
-
58
-
59
-
60
-
61
-
62
-
63
-
64
-
65
-
66
-
67
-
68
-
69
-
70
-
71
-
72
-
73
-
74
-
75
-
76
-
77
-
78
-
79
-
80
-
81
-
82
-
83
-
84
-
85
-
86
-
87
-
88
-
89
-
90
-
91
-
92
-
93
-
94
-
95
-
96
-
97
-
98
-
99
-
100
-
101
-
102
-
103
-
104
-
105
-
106
-
107
-
108
-
109
-
110
-
111
-
112
-
113
-
114
-
115
-
116
-
117
-
118
-
119
-
120
-
121
-
122
-
123
-
124
-
125
-
126
-
127
-
128
-
129
-
130
-
131
-
132
-
133
-
134
-
135
-
136
-
137
-
138
-
139
-
140
-
141
-
142
-
143
-
144
-
145
-
146
-
147
-
148
-
149
-
150
-
151
-
152
-
153
-
154
-
155
-
156
-
157
-
158
-
159
-
160
-
161
-
162
-
163
-
164
-
165
-
166
-
167
-
168
-
169
-
170
-
171
-
172
-
173
-
174
-
175
-
176
-
177
-
178
-
179
-
180
-
181
-
182
-
183
-
184
-
185
-
186
-
187
-
188
-
189
-
190
-
191
-
192
-
193
-
194
-
195
-
196
-
197
-
198
-
199
-
200
-
201
-
202
-
203
-
204
-
205
-
206
-
207
-
208
-
209
-
210
-
211
-
212
-
213
-
214
-
215
-
216
 |
 |

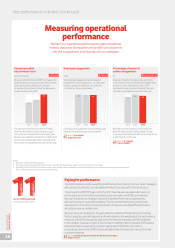
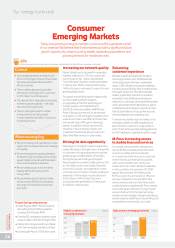
Measuring nancial
performance
We use four main metrics to track our nancial performance.
Financial indicators
Our nancial performance this year saw strong
performances across our emerging markets
offset by continued weakness across many
of our European businesses, reected in our
service revenue and EBITDA performance.
Despite these pressures, and during a period
of signicant investment through Project
Spring, we met our nancial guidance for both
EBITDA and free cash ow and increased our
dividend per share.
Our results this year include a full year
of Vodafone Italy (consolidated from February
2014) and our acquisitions of Ono, Hellas
Online and Cobra Automotive.
We were unable to grow our organic service revenue
this year, mainly as a result of continued pressures
in many European markets. We did, however,
see continued improvements in the growth trends
throughout the year, with positive growth in the nal
quarter of the year.
Free cash ow fell by £3.3 billion over the year,
with the £2.9 billion increase in capital expenditure
not offset by the free cash ow contribution from
Vodafone Italy and Ono. On a guidance basis,
free cash ow was £1.3 billion, in line with the
guidance range.
More on free cash flow and financial year guidance:
Page 39
Reported EBITDA of £11.9 billion increased mainly
due to the inclusion of Italy and Ono. On an organic
basis, EBITDA decreased by 6.9%*, reecting the
ongoing competitive pressures in Europe and the
increased operating costs as a result of Project
Spring. On a guidance basis, EBITDA was £11.7 billion,
in line with the guidance range.
More on EBITDA and nancial year guidance:
Page 39
We increased our dividend per share to 11.22pence
in the year. Our intention remains to grow the
dividend per share annually.
Organic service revenue growth3
More work to do
Free cash ow3
Achieved
EBITDA3
Achieved
Dividend per share
Achieved
Growth in the top line demonstrates our ability
to grow our customer base and stabilise or increase
ARPU. We aim to return to service revenue growth.
Cash generation is key to delivering strong shareholder
returns. Our free cash flow will be depressed during
the period of Project Spring as we increase our capital
expenditure by around half. Our guidance was for
positive free cash flow in the year.
Growth in EBITDA supports our overall protability
and free cash ow which helps fund investment and
shareholder returns. Our guidance was for EBITDA
of £11.3 billion to £11.9 billion in the year, excluding
the results of Ono.
The ordinary dividend remains the primary method
of shareholder return and we have an outstanding
record of growth here. We intended to increase the
dividend per share annually.
More on Financial performance:
Page 38
-0.1
2013 2014 2015
-2.6
-1.6
11.5
2013 2014 2015
11.1
11.9
5.7
2013 2014 2015
4.4
1.1
10.19
2013 2014 2015
11.00 11.22
%
£ billion
£ billion
pence
Changes to KPIs this year
We have updated our KPIs this year
to better align to our strategy and changing
business model.
For our strategic KPIs, we have changed the
focus of European mobile towards 4G and
increasing data usage to better reect the
investments we are making with Project
Spring. We have also expanded the scope
of our strategic KPIs to address the growing
importance of unied communications and
the growth of data in emerging markets.
With the nancial KPIs, we have moved
to an absolute measure of EBITDA rather
than margin and have removed adjusted
operating prot, following the disposal
of our interest in Verizon Wireless in the
2014 nancial year.
We have also removed mobile market
share as a KPI as our focus is on improving
our customer experience and we monitor
the results of that through our nancials.
Overview Strategy review Performance Governance Financials Additional information Vodafone Group Plc
Annual Report 2015
19