Vodafone 2015 Annual Report Download - page 22
Download and view the complete annual report
Please find page 22 of the 2015 Vodafone annual report below. You can navigate through the pages in the report by either clicking on the pages listed below, or by using the keyword search tool below to find specific information within the annual report.-
 1
1 -
2
-
3
-
4
-
5
-
6
-
7
-
8
-
9
-
10
-
11
-
 12
12 -
 13
13 -
 14
14 -
 15
15 -
 16
16 -
 17
17 -
 18
18 -
 19
19 -
 20
20 -
 21
21 -
 22
22 -
 23
23 -
 24
24 -
 25
25 -
 26
26 -
 27
27 -
 28
28 -
 29
29 -
 30
30 -
 31
31 -
 32
32 -
33
-
34
-
35
-
36
-
37
-
38
-
39
-
40
-
41
-
42
-
43
-
44
-
45
-
46
-
47
-
48
-
49
-
50
-
51
-
52
-
53
-
54
-
55
-
56
-
57
-
58
-
59
-
60
-
61
-
62
-
63
-
64
-
65
-
66
-
67
-
68
-
69
-
70
-
71
-
72
-
73
-
74
-
75
-
76
-
77
-
78
-
79
-
80
-
81
-
82
-
83
-
84
-
85
-
86
-
87
-
88
-
89
-
90
-
91
-
92
-
93
-
94
-
95
-
96
-
97
-
98
-
99
-
100
-
101
-
102
-
103
-
104
-
105
-
106
-
107
-
108
-
109
-
110
-
111
-
112
-
113
-
114
-
115
-
116
-
117
-
118
-
119
-
120
-
121
-
122
-
123
-
124
-
125
-
126
-
127
-
128
-
129
-
130
-
131
-
132
-
133
-
134
-
135
-
136
-
137
-
138
-
139
-
140
-
141
-
142
-
143
-
144
-
145
-
146
-
147
-
148
-
149
-
150
-
151
-
152
-
153
-
154
-
155
-
156
-
157
-
158
-
159
-
160
-
161
-
162
-
163
-
164
-
165
-
166
-
167
-
168
-
169
-
170
-
171
-
172
-
173
-
174
-
175
-
176
-
177
-
178
-
179
-
180
-
181
-
182
-
183
-
184
-
185
-
186
-
187
-
188
-
189
-
190
-
191
-
192
-
193
-
194
-
195
-
196
-
197
-
198
-
199
-
200
-
201
-
202
-
203
-
204
-
205
-
206
-
207
-
208
-
209
-
210
-
211
-
212
-
213
-
214
-
215
-
216
 |
 |

Key performance indicators (continued)
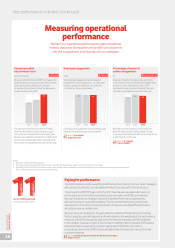
Measuring operational
performance
We track our operational performance against three key
metrics that cover the experience we offer our customers
and the engagement and diversity of our employees.
Paying for performance
The incentive plans used to reward the performance of our Directors and our senior managers,
with some local variances, include measures linked to our key performance indicators.
The annual bonus (‘GSTIP’) pay-out for the 2015 nancial year was dependent upon our
performance across three nancial measures (service revenue, EBITDA, and adjusted
free cash ow) and one strategic measure (Competitive Performance assessment),
with each having an equal 25% weighting. The Competitive Performance assessment
was based on a market-by-market assessment of measures including NPS performance
and relative revenue market share.
We are making two changes for the year ahead to underline the importance of providing
the best possible customer experience. We will rebalance the weightings of the performance
measures with 60% being equally split across the nancial measures and 40% weighted
to the strategic measures. In light of this increase in weighting the Competitive Performance
assessment will be replaced by Customer Appreciation KPIs which will continue
to include an assessment of NPS and we will add in Brand Consideration along with other
customer measures.
Our employee engagement score remains broadly
stable and we retained a top quartile position.
More on Our people:
Pages 28 and 29
This year we increased the number of markets
where we are ranked number one and our goal
is to continue to increase this number every year.
We are now ranked rst or joint rst in mobile in four
of our top six markets (Italy, Spain, India and South
Africa) while we lag behind in the UK and Germany.
We have not made progress on this metric this
year, with the proportion falling slightly. To help
improve gender diversity further, we launched a new
maternity policy in the year.
More on Our people:
Pages 28 and 29
Employee engagement
Achieved
Consumer mobile
net promoter score
Achieved
Percentage of women in
senior management
More work to do
The employee engagement score measures
employees’ level of engagement – a combination
of pride, loyalty and motivation. Our goal here
is to retain our top quartile position.
We use net promoter scores (‘NPS’) to measure the
extent to which our customers would recommend
us to friends and family. We aim to increase
or maintain the number of markets where we are
ranked number one by NPS.
Diversity increases the range of skills and styles
in our business and increased female representation
across our senior management (top c.1,600
employees) is one measure of diversity. Our goal
is simple, to increase the proportion each year.
8
2013 2014 2015
9
11 78
2013 2014 2015
77 77 22
2013 2014 2015
24 23
out of 13 KPIs achieved
versus 9 out of 12 in 2014
Notes:
1 Based on Android and iPhone devices.
2 Emerging markets comprise DRC, Egypt, Ghana, India, Lesotho, Mozambique, Qatar, South Africa, Tanzania and Turkey.
3 Financials for 2013 and 2014 are shown on the current statutory basis, including the results of the Group’s joint ventures using the equity accounting basis.
Free cash ow excludes restructuring costs in all periods.
out of 21 markets index %
More on rewards for performance in the Remuneration report:
Pages 75 to 91
Vodafone Group Plc
Annual Report 2015
20