Vodafone 2015 Annual Report Download - page 45
Download and view the complete annual report
Please find page 45 of the 2015 Vodafone annual report below. You can navigate through the pages in the report by either clicking on the pages listed below, or by using the keyword search tool below to find specific information within the annual report.-
 1
1 -
2
-
3
-
4
-
5
-
6
-
7
-
8
-
9
-
10
-
11
-
12
-
13
-
14
-
15
-
16
-
17
-
18
-
19
-
20
-
21
-
22
-
23
-
24
-
25
-
26
-
27
-
28
-
29
-
30
-
31
-
32
-
33
-
34
-
 35
35 -
 36
36 -
 37
37 -
 38
38 -
 39
39 -
 40
40 -
 41
41 -
 42
42 -
 43
43 -
 44
44 -
 45
45 -
 46
46 -
 47
47 -
 48
48 -
 49
49 -
 50
50 -
 51
51 -
 52
52 -
 53
53 -
 54
54 -
 55
55 -
56
-
57
-
58
-
59
-
60
-
61
-
62
-
63
-
64
-
65
-
66
-
67
-
68
-
69
-
70
-
71
-
72
-
73
-
74
-
75
-
76
-
77
-
78
-
79
-
80
-
81
-
82
-
83
-
84
-
85
-
86
-
87
-
88
-
89
-
90
-
91
-
92
-
93
-
94
-
95
-
96
-
97
-
98
-
99
-
100
-
101
-
102
-
103
-
104
-
105
-
106
-
107
-
108
-
109
-
110
-
111
-
112
-
113
-
114
-
115
-
116
-
117
-
118
-
119
-
120
-
121
-
122
-
123
-
124
-
125
-
126
-
127
-
128
-
129
-
130
-
131
-
132
-
133
-
134
-
135
-
136
-
137
-
138
-
139
-
140
-
141
-
142
-
143
-
144
-
145
-
146
-
147
-
148
-
149
-
150
-
151
-
152
-
153
-
154
-
155
-
156
-
157
-
158
-
159
-
160
-
161
-
162
-
163
-
164
-
165
-
166
-
167
-
168
-
169
-
170
-
171
-
172
-
173
-
174
-
175
-
176
-
177
-
178
-
179
-
180
-
181
-
182
-
183
-
184
-
185
-
186
-
187
-
188
-
189
-
190
-
191
-
192
-
193
-
194
-
195
-
196
-
197
-
198
-
199
-
200
-
201
-
202
-
203
-
204
-
205
-
206
-
207
-
208
-
209
-
210
-
211
-
212
-
213
-
214
-
215
-
216
 |
 |

Overview Strategy review Performance Governance Financials Additional information Vodafone Group Plc
Annual Report 2015
43
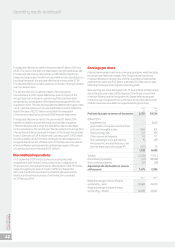
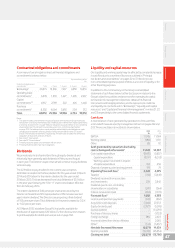
Revenue increased 15.9%. M&A activity, including KDG, Ono and the
consolidation of Vodafone Italy, contributed a 26.6 percentage point
positive impact, while foreign exchange movements contributed
a 6.5percentage point negative impact. On an organic basis, service
revenue declined 4.7%*, driven primarily by price competition and the
impact of MTR cuts.
EBITDA increased 16.2%, including a 35.5 percentage point positive
impact from M&A activity and a 7.0 percentage point negative impact
from foreign exchange movements. On an organic basis EBITDA
declined 12.3%*, reecting the weak organic revenue trend.
Organic
change
%
Other
activity1
pps
Foreign
exchange
pps
Reported
change
%
Revenue – Europe (4.2) 26.6 (6.5) 15.9
Service revenue
Germany (3.2) 11 .9 ( 7. 5 ) 1.2
Italy (9.7) 921.0 (126.1) 785.2
UK (1.2) 1.4 –0.2
Spain (10.5) 22.5 (7.6) 4.4
Other Europe (2.1) 0.8 (7.3) (8.6)
Europe (4.7) 26.1 (6.4) 15.0
EBITDA
Germany (10.9) 17.2 (7.3) (1.0)
Italy (15.2) 883.2 (123.5) 744.5
UK (12.5) 8.4 –(4.1)
Spain (29.5) 36.3 (7.3) (0.5)
Other Europe (2.8) 0.5 (7.0) (9.3)
Europe (12.3) 35.5 (7.0) 16.2
Europe adjusted
operating prot (40.2) 20.4 (4.6) (24.4)
Note:
1 “Other activity” includes the impact of M&A activity. Refer to “Organic growth” on page 203
for further detail.
Germany
Service revenue decreased 3.2%* excluding KDG. Q4 service revenue
was down 3.1%*.
Mobile service revenue fell 3.5%*, mainly as a result of price reductions
in the prior year continuing to penetrate the consumer customer
base. The contract customer base grew, supported by a stronger
commercial performance as we look to increase our focus on direct,
branded channels, falling churn and the ongoing substantial investment
in network infrastructure. We increased our 4G coverage to 77% of the
population and signicantly improved voice coverage and reliability,
as evidenced in independent tests. At the end of the period we had
5.0 million 4G customers.
Fixed service revenue excluding KDG fell 2.1%*, reecting ongoing
declines in our Vodafone DSL customer base, in part from migrations
to KDG cable infrastructure. The rate of decline eased during the
year (H1 -2.9%*; H2 -1.2%*), with an improving rate of gross customer
additions and increasing demand for high speed broadband (‘VDSL’),
as well as stronger growth in carrier services. KDG maintained its
strong rate of growth, contributing £1,492 million to service revenue
and £676 million to EBITDA, and adding 0.4 million broadband
customers (excluding migrations from Vodafone DSL) during the
year. The integration of KDG has continued, including the launch
of a combined xed/mobile proposition in H2.
EBITDA declined 10.9%*, with a 3.1* percentage point decline in EBITDA
margin, driven by lower service revenue and a higher level of customer
investment year-on-year, partially compensated by a year-on-year
reduction in operating expenses.
Italy
Service revenue declined 9.7%*. Trends in both mobile and xed line
improved in H2, and Q4 service revenue declined 3.7%*.
Mobile service revenue fell 12.1%* as a result of a decline in the prepaid
customer base and lower ARPU following last year’s price cuts. We took
a number of measures to stabilise ARPU during the year, and in Q4,
consumer prepaid ARPU was up 6% year-on-year. We also began
to take a more active stance on stabilising the customer base in the
second half of the year, in what remains a very competitive market.
Enterprise performed strongly, returning to growth in H2. We now have
4G coverage of 84%, and 2.8 million 4G customers at 31 March 2015.
Fixed service revenue was up 4.5%*. Broadband revenue continued
to grow and we added 134,000 broadband customers over the year,
but overall growth was partially offset by an ongoing decline in xed
voice usage. We accelerated our bre roll-out plans in H2, and by March
2015 we had installed more than 5,000 cabinets.
EBITDA declined 15.2%*, with a 2.6* percentage point decline in EBITDA
margin. The decline in service revenue was partially offset by continued
strong cost control, with operating expenses down 3.1%* and customer
investment down 3.0%*.
Europe
Germany
£m
Italy
£m
UK
£m
Spain
£m
Other Europe
£m
Eliminations
£m
Europe
£m
2014
£m
% change
£Organic
Year ended 31 March 2015
Revenue 8,467 4,641 6,414 3,664 5,007 (122) 28,071 24,222 15.9 (4.2)
Service revenue 7, 8 2 9 4 ,116 6 ,10 9 3,371 4,664 (117) 25,972 22,592 15 .0 (4.7)
Other revenue 638 525 305 293 343 (5) 2,099 1,630
EBITDA 2,670 1,537 1,360 783 1, 574 –7,924 6,821 16.2 (12.3)
Adjusted operating prot 541 647 41 3 531 –1,763 2,333 (24.4) (40.2)
EBITDA margin 31.5% 33.1% 21.2% 21.4% 31.4% 28.2% 28.2%