Nokia 2010 Annual Report Download - page 91
Download and view the complete annual report
Please find page 91 of the 2010 Nokia annual report below. You can navigate through the pages in the report by either clicking on the pages listed below, or by using the keyword search tool below to find specific information within the annual report.-
 1
1 -
2
-
3
-
4
-
5
-
6
-
7
-
8
-
9
-
10
-
11
-
12
-
13
-
14
-
15
-
16
-
17
-
18
-
19
-
20
-
21
-
22
-
23
-
24
-
25
-
26
-
27
-
28
-
29
-
30
-
31
-
32
-
33
-
34
-
35
-
36
-
37
-
38
-
39
-
40
-
41
-
42
-
43
-
44
-
45
-
46
-
47
-
48
-
49
-
50
-
51
-
52
-
53
-
54
-
55
-
56
-
57
-
58
-
59
-
60
-
61
-
62
-
63
-
64
-
65
-
66
-
67
-
68
-
69
-
70
-
71
-
72
-
73
-
74
-
75
-
76
-
77
-
78
-
79
-
80
-
 81
81 -
 82
82 -
 83
83 -
 84
84 -
 85
85 -
 86
86 -
 87
87 -
 88
88 -
 89
89 -
 90
90 -
 91
91 -
 92
92 -
 93
93 -
 94
94 -
 95
95 -
 96
96 -
 97
97 -
 98
98 -
 99
99 -
 100
100 -
 101
101 -
102
-
103
-
104
-
105
-
106
-
107
-
108
-
109
-
110
-
111
-
112
-
113
-
114
-
115
-
116
-
117
-
118
-
119
-
120
-
121
-
122
-
123
-
124
-
125
-
126
-
127
-
128
-
129
-
130
-
131
-
132
-
133
-
134
-
135
-
136
-
137
-
138
-
139
-
140
-
141
-
142
-
143
-
144
-
145
-
146
-
147
-
148
-
149
-
150
-
151
-
152
-
153
-
154
-
155
-
156
-
157
-
158
-
159
-
160
-
161
-
162
-
163
-
164
-
165
-
166
-
167
-
168
-
169
-
170
-
171
-
172
-
173
-
174
-
175
-
176
-
177
-
178
-
179
-
180
-
181
-
182
-
183
-
184
-
185
-
186
-
187
-
188
-
189
-
190
-
191
-
192
-
193
-
194
-
195
-
196
-
197
-
198
-
199
-
200
-
201
-
202
-
203
-
204
-
205
-
206
-
207
-
208
-
209
-
210
-
211
-
212
-
213
-
214
-
215
-
216
-
217
-
218
-
219
-
220
-
221
-
222
-
223
-
224
-
225
-
226
-
227
-
228
-
229
-
230
-
231
-
232
-
233
-
234
-
235
-
236
-
237
-
238
-
239
-
240
-
241
-
242
-
243
-
244
-
245
-
246
-
247
-
248
-
249
-
250
-
251
-
252
-
253
-
254
-
255
-
256
-
257
-
258
-
259
-
260
-
261
-
262
-
263
-
264
-
265
-
266
-
267
-
268
-
269
-
270
-
271
-
272
-
273
-
274
-
275
 |
 |
12 month hedging horizon. For the majority of these hedges, hedge accounting is applied to reduce
profit and loss volatility. We also hedge significant balance sheet exposures. Our balance sheet is also
affected by the translation into euro for financial reporting purposes of the shareholders’ equity of
our foreign subsidiaries that are denominated in currencies other than the euro. In general, this
translation increases our shareholders’ equity when the euro depreciates, and affects shareholders’
equity adversely when the euro appreciates against the relevant other currencies (yearend rate to
previous yearend rate). To mitigate the impact to shareholders’ equity, Nokia hedges selected net
investment exposures from time to time.
During 2010, the volatility of the currency market remained broadly around the same level as in 2009,
but remained elevated compared to levels during the first half of 2008. At the same time, the
currency market liquidity conditions continued to improve. Overall hedging costs remained relatively
low in 2010 due to the low interest rate environment.
In 2010, during the first half the year, the US dollar appreciated against the euro by 20.8%. After that,
the US dollar gave away some of those gains, and at the end of 2010 the US dollar was 13.0%
stronger against the euro than at the end of 2009.
The stronger US dollar during the last two months of 2010 had a positive impact on our net sales
expressed in euro as approximately 40% of our net sales are generated in US dollars and currencies
closely following the US dollar. However, the appreciation of the US dollar also contributed to a higher
average product cost as approximately 60% of the components we use are sourced in the US dollar.
During 2010, we increased the percentage of our direct material purchases in US dollars, as this helps
to balance our net US dollar position. In total, the movements of the US dollar against the euro had a
slightly negative impact on our operating profit in 2010.
In 2010, the Japanese yen appreciated by 20.8% against the euro. During 2010, approximately 15% of
the devices components we used were sourced in the Japanese yen and, consequently, the
appreciation of the Japanese yen had a negative impact on our operating profit in 2010. We have
taken action in 2010 to further reduce our devices sourcing costs in the Japanese yen, including price
negotiations with our suppliers and shifting the sourcing of certain components to nonJapanese
suppliers. At the end of 2010, we had decreased the amount of device components we source in
Japanese yen to approximately 12% of our total costs of sales.
In 2010, emerging market currencies faced appreciation pressures and performed strongly. The
Chinese yuan and the Indian rupee performed the best appreciating by 15.8% and 15.3%,
respectively, against the euro. Also, the Brazilian reais and the Russian ruble appreciated by 14.0%
and 5.8%, respectively, against the euro.
In general, the depreciation of an emerging market currency has a negative impact on our operating
profit due to reduced revenue in euro terms and/or the reduced purchasing power of customers in
the emerging market. The appreciation of an emerging market currency generally has a positive
impact on our operating profit.
Significant changes in exchange rates may also impact our competitive position and related price
pressures through their impact on our competitors.
For a discussion on the instruments used by Nokia in connection with our hedging activities, see
Note 35 to our consolidated financial statements included in Item 18 of this annual report. See also
Item 11. “Quantitative and Qualitative Disclosures About Market Risk” and Item 3D. “Risk Factors.”
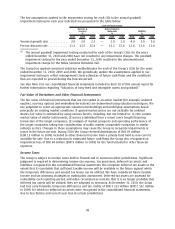
Seasonality
Our Devices & Services sales are somewhat affected by seasonality. Historically, the first quarter of the
year has been the lowest quarter of the year and the fourth quarter has been the strongest quarter,
mainly due to the effect of holiday sales. However, over time we have seen a trend towards less
pronounced seasonality. The difference between the sequential holiday seasonal increase in the
Western hemisphere in fourth quarter and subsequent decrease in first quarter sequential volumes
90