Nokia 2010 Annual Report Download - page 238
Download and view the complete annual report
Please find page 238 of the 2010 Nokia annual report below. You can navigate through the pages in the report by either clicking on the pages listed below, or by using the keyword search tool below to find specific information within the annual report.-
 1
1 -
2
-
3
-
4
-
5
-
6
-
7
-
8
-
9
-
10
-
11
-
12
-
13
-
14
-
15
-
16
-
17
-
18
-
19
-
20
-
21
-
22
-
23
-
24
-
25
-
26
-
27
-
28
-
29
-
30
-
31
-
32
-
33
-
34
-
35
-
36
-
37
-
38
-
39
-
40
-
41
-
42
-
43
-
44
-
45
-
46
-
47
-
48
-
49
-
50
-
51
-
52
-
53
-
54
-
55
-
56
-
57
-
58
-
59
-
60
-
61
-
62
-
63
-
64
-
65
-
66
-
67
-
68
-
69
-
70
-
71
-
72
-
73
-
74
-
75
-
76
-
77
-
78
-
79
-
80
-
81
-
82
-
83
-
84
-
85
-
86
-
87
-
88
-
89
-
90
-
91
-
92
-
93
-
94
-
95
-
96
-
97
-
98
-
99
-
100
-
101
-
102
-
103
-
104
-
105
-
106
-
107
-
108
-
109
-
110
-
111
-
112
-
113
-
114
-
115
-
116
-
117
-
118
-
119
-
120
-
121
-
122
-
123
-
124
-
125
-
126
-
127
-
128
-
129
-
130
-
131
-
132
-
133
-
134
-
135
-
136
-
137
-
138
-
139
-
140
-
141
-
142
-
143
-
144
-
145
-
146
-
147
-
148
-
149
-
150
-
151
-
152
-
153
-
154
-
155
-
156
-
157
-
158
-
159
-
160
-
161
-
162
-
163
-
164
-
165
-
166
-
167
-
168
-
169
-
170
-
171
-
172
-
173
-
174
-
175
-
176
-
177
-
178
-
179
-
180
-
181
-
182
-
183
-
184
-
185
-
186
-
187
-
188
-
189
-
190
-
191
-
192
-
193
-
194
-
195
-
196
-
197
-
198
-
199
-
200
-
201
-
202
-
203
-
204
-
205
-
206
-
207
-
208
-
209
-
210
-
211
-
212
-
213
-
214
-
215
-
216
-
217
-
218
-
219
-
220
-
221
-
222
-
223
-
224
-
225
-
226
-
227
-
 228
228 -
 229
229 -
 230
230 -
 231
231 -
 232
232 -
 233
233 -
 234
234 -
 235
235 -
 236
236 -
 237
237 -
 238
238 -
 239
239 -
 240
240 -
 241
241 -
 242
242 -
 243
243 -
 244
244 -
 245
245 -
 246
246 -
 247
247 -
 248
248 -
249
-
250
-
251
-
252
-
253
-
254
-
255
-
256
-
257
-
258
-
259
-
260
-
261
-
262
-
263
-
264
-
265
-
266
-
267
-
268
-
269
-
270
-
271
-
272
-
273
-
274
-
275
 |
 |

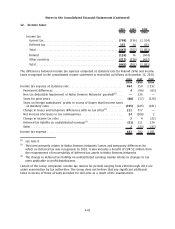
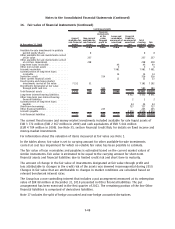
16. Fair value of financial instruments (Continued)
include assets and liabilities for which pricing is obtained via pricing services, but where prices have
not been determined in an active market, financial assets with fair values based on broker quotes and
assets that are valued using the Group’s own valuation models whereby the material assumptions are
market observable. The majority of Group’s overthecounter derivatives and several other
instruments not traded in active markets fall within this category.
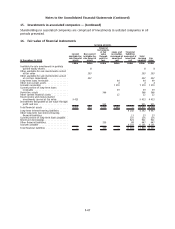
Level 3 category includes financial assets and liabilities measured using valuation techniques based
on non market observable inputs. This means that fair values are determined in whole or in part
using a valuation model based on assumptions that are neither supported by prices from observable
current market transactions in the same instrument nor are they based on available market data.
However, the fair value measurement objective remains the same, that is, to estimate an exit price
from the perspective of the Group. The main asset classes in this category are unlisted equity
investments as well as unlisted funds.
The following table shows a reconciliation of the opening and closing recorded amount of Level 3
financial assets, which are measured at fair value:
EURm
Other
availableforsale
investments carried at
fair value
Balance at December 31, 2008 ....................................... 214
Total gains (losses) in income statement ................................. (30)
Total gains (losses) recorded in other comprehensive income ................ 15
Purchases ......................................................... 45
Sales ............................................................. (2)
Transfer from level 1 and 2............................................ —
Balance at December 31, 2009 ....................................... 242
Total gains (losses) in income statement ................................. 3
Total gains (losses) recorded in other comprehensive income ................ (11)
Purchases ......................................................... 78
Sales ............................................................. (34)
Transfer from associated companies..................................... 1
Transfer from level 1 and 2............................................ —
Balance at December 31, 2010 ....................................... 279
The gains and losses from Level 3 financial instruments are included in the line other operating
expenses of the income statement for the respective period. A net loss of EUR 12 million (EUR
14 million in 2009) related to Level 3 financial instruments held at December 31, 2010, was included
in the income statement during 2010.
F50
Notes to the Consolidated Financial Statements (Continued)