Nokia 2010 Annual Report Download - page 272
Download and view the complete annual report
Please find page 272 of the 2010 Nokia annual report below. You can navigate through the pages in the report by either clicking on the pages listed below, or by using the keyword search tool below to find specific information within the annual report.-
 1
1 -
2
-
3
-
4
-
5
-
6
-
7
-
8
-
9
-
10
-
11
-
12
-
13
-
14
-
15
-
16
-
17
-
18
-
19
-
20
-
21
-
22
-
23
-
24
-
25
-
26
-
27
-
28
-
29
-
30
-
31
-
32
-
33
-
34
-
35
-
36
-
37
-
38
-
39
-
40
-
41
-
42
-
43
-
44
-
45
-
46
-
47
-
48
-
49
-
50
-
51
-
52
-
53
-
54
-
55
-
56
-
57
-
58
-
59
-
60
-
61
-
62
-
63
-
64
-
65
-
66
-
67
-
68
-
69
-
70
-
71
-
72
-
73
-
74
-
75
-
76
-
77
-
78
-
79
-
80
-
81
-
82
-
83
-
84
-
85
-
86
-
87
-
88
-
89
-
90
-
91
-
92
-
93
-
94
-
95
-
96
-
97
-
98
-
99
-
100
-
101
-
102
-
103
-
104
-
105
-
106
-
107
-
108
-
109
-
110
-
111
-
112
-
113
-
114
-
115
-
116
-
117
-
118
-
119
-
120
-
121
-
122
-
123
-
124
-
125
-
126
-
127
-
128
-
129
-
130
-
131
-
132
-
133
-
134
-
135
-
136
-
137
-
138
-
139
-
140
-
141
-
142
-
143
-
144
-
145
-
146
-
147
-
148
-
149
-
150
-
151
-
152
-
153
-
154
-
155
-
156
-
157
-
158
-
159
-
160
-
161
-
162
-
163
-
164
-
165
-
166
-
167
-
168
-
169
-
170
-
171
-
172
-
173
-
174
-
175
-
176
-
177
-
178
-
179
-
180
-
181
-
182
-
183
-
184
-
185
-
186
-
187
-
188
-
189
-
190
-
191
-
192
-
193
-
194
-
195
-
196
-
197
-
198
-
199
-
200
-
201
-
202
-
203
-
204
-
205
-
206
-
207
-
208
-
209
-
210
-
211
-
212
-
213
-
214
-
215
-
216
-
217
-
218
-
219
-
220
-
221
-
222
-
223
-
224
-
225
-
226
-
227
-
228
-
229
-
230
-
231
-
232
-
233
-
234
-
235
-
236
-
237
-
238
-
239
-
240
-
241
-
242
-
243
-
244
-
245
-
246
-
247
-
248
-
249
-
250
-
251
-
252
-
253
-
254
-
255
-
256
-
257
-
258
-
259
-
260
-
261
-
 262
262 -
 263
263 -
 264
264 -
 265
265 -
 266
266 -
 267
267 -
 268
268 -
 269
269 -
 270
270 -
 271
271 -
 272
272 -
 273
273 -
 274
274 -
 275
275
 |
 |

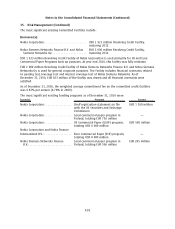
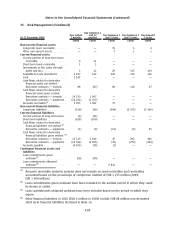
35. Risk Management (Continued)
At 31 December 2009
Due within
3 months
Due between 3
and 12
months
Due between 1
and 3 years
Due between 3
and 5 years
Due beyond
5 years
EURm EURm EURm EURm EURm
Noncurrent financial assets
Longterm loans receivable . . . . . . . . — — 36 6 4
Other noncurrent assets . . . . . . . . . . — — 3 1 1
Current financial assets
Current portion of longterm loans
receivable ................... 4 11 — — —
Shortterm loans receivable . . . . . . . . 1 1 — — —
Investments at fair value through
profitandloss................ 3 22 29 515 139
Availableforsale investment. . . . . . . 6 417 322 290 110 116
Cash......................... 1142 — — — —
Cash flows related to derivative
financial assets net settled :
Derivative contracts — receipts . . . 88 (47) 80 110 27
Cash flows related to derivative
financial assets gross settled:
Derivative contracts — receipts . . . 14 350 1 067 — — —
Derivative contracts — payments . . (14 201) (1 037) — — —
Accounts receivable
(1)
............ 5903 1002 73 — —
Noncurrent financial liabilities
Longterm liabilities . . . . . . . . . . . . . (124) (96) (594) (2 973) (2 596)
Current financial liabilities
Current portion of longterm loans . . (3) (41) — — —
Shortterm liabilities . . . . . . . . . . . . . (628) (100) — — —
Cash flows related to derivative
financial liabilities net settled:
(5)
Derivative contracts — payments . . (1) (4) (11) (3) 55
Cash flows related to derivative
financial liabilities gross settled:
(5)
Derivative contracts — receipts . . . 14 529 1 444 45 292 466
Derivative contracts — payments . . (14 652) (1 455) (36) (279) (469)
Accounts payable . . . . . . . . . . . . . . . (4 873) (74) (3) — —
Contingent financial assets and
liabilities
Loan commitments given
undrawn
(2)
................... (59) (40) — — —
Loan commitments obtained
undrawn
(3)
................... — — 2841 — —
(1)
Accounts receivable maturity analysis does not include accrued receivables and receivables
accounted based on the percentage of completion method of EUR 1 235 million (2009:
EUR 1 004 million).
(2)
Loan commitments given undrawn have been included in the earliest period in which they could
be drawn or called.
(3)
Loan commitments obtained undrawn have been included based on the period in which they
expire.
(4)
Other financial liabilities in 2010 (EUR 0 million in 2009) include EUR 88 million nonderivative
short term financial liabilities disclosed in Note 16.
F84
Notes to the Consolidated Financial Statements (Continued)