Nokia 2010 Annual Report Download - page 251
Download and view the complete annual report
Please find page 251 of the 2010 Nokia annual report below. You can navigate through the pages in the report by either clicking on the pages listed below, or by using the keyword search tool below to find specific information within the annual report.-
 1
1 -
2
-
3
-
4
-
5
-
6
-
7
-
8
-
9
-
10
-
11
-
12
-
13
-
14
-
15
-
16
-
17
-
18
-
19
-
20
-
21
-
22
-
23
-
24
-
25
-
26
-
27
-
28
-
29
-
30
-
31
-
32
-
33
-
34
-
35
-
36
-
37
-
38
-
39
-
40
-
41
-
42
-
43
-
44
-
45
-
46
-
47
-
48
-
49
-
50
-
51
-
52
-
53
-
54
-
55
-
56
-
57
-
58
-
59
-
60
-
61
-
62
-
63
-
64
-
65
-
66
-
67
-
68
-
69
-
70
-
71
-
72
-
73
-
74
-
75
-
76
-
77
-
78
-
79
-
80
-
81
-
82
-
83
-
84
-
85
-
86
-
87
-
88
-
89
-
90
-
91
-
92
-
93
-
94
-
95
-
96
-
97
-
98
-
99
-
100
-
101
-
102
-
103
-
104
-
105
-
106
-
107
-
108
-
109
-
110
-
111
-
112
-
113
-
114
-
115
-
116
-
117
-
118
-
119
-
120
-
121
-
122
-
123
-
124
-
125
-
126
-
127
-
128
-
129
-
130
-
131
-
132
-
133
-
134
-
135
-
136
-
137
-
138
-
139
-
140
-
141
-
142
-
143
-
144
-
145
-
146
-
147
-
148
-
149
-
150
-
151
-
152
-
153
-
154
-
155
-
156
-
157
-
158
-
159
-
160
-
161
-
162
-
163
-
164
-
165
-
166
-
167
-
168
-
169
-
170
-
171
-
172
-
173
-
174
-
175
-
176
-
177
-
178
-
179
-
180
-
181
-
182
-
183
-
184
-
185
-
186
-
187
-
188
-
189
-
190
-
191
-
192
-
193
-
194
-
195
-
196
-
197
-
198
-
199
-
200
-
201
-
202
-
203
-
204
-
205
-
206
-
207
-
208
-
209
-
210
-
211
-
212
-
213
-
214
-
215
-
216
-
217
-
218
-
219
-
220
-
221
-
222
-
223
-
224
-
225
-
226
-
227
-
228
-
229
-
230
-
231
-
232
-
233
-
234
-
235
-
236
-
237
-
238
-
239
-
240
-
 241
241 -
 242
242 -
 243
243 -
 244
244 -
 245
245 -
 246
246 -
 247
247 -
 248
248 -
 249
249 -
 250
250 -
 251
251 -
 252
252 -
 253
253 -
 254
254 -
 255
255 -
 256
256 -
 257
257 -
 258
258 -
 259
259 -
 260
260 -
 261
261 -
262
-
263
-
264
-
265
-
266
-
267
-
268
-
269
-
270
-
271
-
272
-
273
-
274
-
275
 |
 |

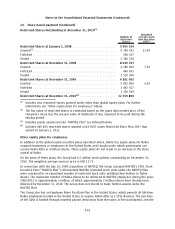
24. Sharebased payment (Continued)
Restricted Shares Outstanding at December 31, 2010
(1)
Number of
Restricted
Shares
Weighted
average grant
date fair value
EUR
(2)
Restricted Shares at January 1, 2008 ........................... 5 995 329
Granted
(3)
................................................... 4799543 13.89
Forfeited ................................................... 358747
Vested ..................................................... 2386728
Restricted Shares at December 31, 2008 ........................ 8 049 397
Granted .................................................... 4288600 7.59
Forfeited ................................................... 446695
Vested ..................................................... 2510300
Restricted Shares at December 31, 2009 ........................ 9 381 002
Granted .................................................... 5801800 6.85
Forfeited ................................................... 1492357
Vested ..................................................... 1330549
Restricted Shares at December 31, 2010
(4)
...................... 12 359 896
(1)
Includes also restricted shares granted under other than global equity plans. For further
information see “Other equity plans for employees” below.
(2)
The fair value of restricted shares is estimated based on the grant date market price of the
Company’s share less the present value of dividends, if any, expected to be paid during the
vesting period.
(3)
Includes grants assumed under “NAVTEQ Plan” (as defined below).
(4)
Includes 849 800 restricted shares granted in Q4 2007 under Restricted Share Plan 2007 that
vested on January 1, 2011.
Other equity plans for employees
In addition to the global equity incentive plans described above, Nokia has equity plans for Nokia
acquired businesses or employees in the United States and Canada under which participants can
receive Nokia ADSs or ordinary shares. These equity plans do not result in an increase in the share
capital of Nokia.
On the basis of these plans, the Group had 0.2 million stock options outstanding on December 31,
2010. The weighted average exercise price is USD 13.72.
In connection with the July 10, 2008 acquisition of NAVTEQ, the Group assumed NAVTEQ’s 2001 Stock
Incentive Plan (“NAVTEQ Plan”). All unvested NAVTEQ restricted stock units under the NAVTEQ Plan
were converted to an equivalent number of restricted stock units entitling their holders to Nokia
shares. The maximum number of Nokia shares to be delivered to NAVTEQ employees during the years
20082012 is approximately 3 million, of which approximately 2 million shares have already been
delivered by December 31, 2010. The Group does not intend to make further awards under the
NAVTEQ Plan.
The Group also has an Employee Share Purchase Plan in the United States, which permits all fulltime
Nokia employees located in the United States to acquire Nokia ADSs at a 15% discount. The purchase
of the ADSs is funded through monthly payroll deductions from the salary of the participants, and the
F63
Notes to the Consolidated Financial Statements (Continued)