Nokia 2010 Annual Report Download - page 111
Download and view the complete annual report
Please find page 111 of the 2010 Nokia annual report below. You can navigate through the pages in the report by either clicking on the pages listed below, or by using the keyword search tool below to find specific information within the annual report.-
 1
1 -
2
-
3
-
4
-
5
-
6
-
7
-
8
-
9
-
10
-
11
-
12
-
13
-
14
-
15
-
16
-
17
-
18
-
19
-
20
-
21
-
22
-
23
-
24
-
25
-
26
-
27
-
28
-
29
-
30
-
31
-
32
-
33
-
34
-
35
-
36
-
37
-
38
-
39
-
40
-
41
-
42
-
43
-
44
-
45
-
46
-
47
-
48
-
49
-
50
-
51
-
52
-
53
-
54
-
55
-
56
-
57
-
58
-
59
-
60
-
61
-
62
-
63
-
64
-
65
-
66
-
67
-
68
-
69
-
70
-
71
-
72
-
73
-
74
-
75
-
76
-
77
-
78
-
79
-
80
-
81
-
82
-
83
-
84
-
85
-
86
-
87
-
88
-
89
-
90
-
91
-
92
-
93
-
94
-
95
-
96
-
97
-
98
-
99
-
100
-
 101
101 -
 102
102 -
 103
103 -
 104
104 -
 105
105 -
 106
106 -
 107
107 -
 108
108 -
 109
109 -
 110
110 -
 111
111 -
 112
112 -
 113
113 -
 114
114 -
 115
115 -
 116
116 -
 117
117 -
 118
118 -
 119
119 -
 120
120 -
 121
121 -
122
-
123
-
124
-
125
-
126
-
127
-
128
-
129
-
130
-
131
-
132
-
133
-
134
-
135
-
136
-
137
-
138
-
139
-
140
-
141
-
142
-
143
-
144
-
145
-
146
-
147
-
148
-
149
-
150
-
151
-
152
-
153
-
154
-
155
-
156
-
157
-
158
-
159
-
160
-
161
-
162
-
163
-
164
-
165
-
166
-
167
-
168
-
169
-
170
-
171
-
172
-
173
-
174
-
175
-
176
-
177
-
178
-
179
-
180
-
181
-
182
-
183
-
184
-
185
-
186
-
187
-
188
-
189
-
190
-
191
-
192
-
193
-
194
-
195
-
196
-
197
-
198
-
199
-
200
-
201
-
202
-
203
-
204
-
205
-
206
-
207
-
208
-
209
-
210
-
211
-
212
-
213
-
214
-
215
-
216
-
217
-
218
-
219
-
220
-
221
-
222
-
223
-
224
-
225
-
226
-
227
-
228
-
229
-
230
-
231
-
232
-
233
-
234
-
235
-
236
-
237
-
238
-
239
-
240
-
241
-
242
-
243
-
244
-
245
-
246
-
247
-
248
-
249
-
250
-
251
-
252
-
253
-
254
-
255
-
256
-
257
-
258
-
259
-
260
-
261
-
262
-
263
-
264
-
265
-
266
-
267
-
268
-
269
-
270
-
271
-
272
-
273
-
274
-
275
 |
 |

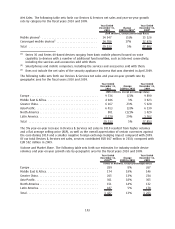
Nokia Group
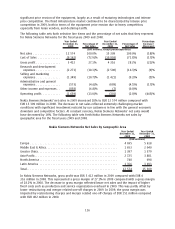
The following table sets forth selective line items and the percentage of net sales that they represent
for the fiscal years 2009 and 2008.
Year Ended
December 31,
2009
Percentage of
Net Sales
Year Ended
December 31,
2008
Percentage of
Net Sales
Percentage
Increase/
(Decrease)
(EUR millions, except percentage data)
Net sales ................. 40984 100.0% 50 710 100.0% (19.2)%
Cost of sales .............. (27720) (67.6)% (33 337) (65.7)% (16.8)%
Gross profit ............... 13264 32.4% 17 373 34.3% (23.7)%
Research and development
expenses ............... (5909) (14.4)% (5 968) (11.8)% (1.0)%
Selling and marketing
expenses ............... (3933) (9.6)% (4 380) (8.6)% (10.2)%
Administrative and general
expenses ............... (1145) (2.8)% (1 284) (2.5)% (10.8)%
Other operating income and
expenses ............... (1080) (2.6)% (775) (1.5)% 39.4%
Operating profit............ 1197 2.9% 4 966 9.8% 75.9%
For 2009, our net sales decreased 19.2% to EUR 40 984 million compared with EUR 50 710 million in
2008. The decrease in net sales was primarily driven by the deteriorated global economic conditions
during 2009, including weaker consumer and corporate spending, constrained credit availability and
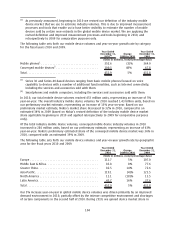
currency market volatility. The following table sets forth the distribution by geographical area of our
net sales for the fiscal years 2009 and 2008.
2009 2008
Year Ended
December 31,
Europe .................................................................. 36% 37%
Middle East & Africa ........................................................ 14% 14%
Greater China ............................................................. 16% 13%
AsiaPacific............................................................... 22% 22%
North America ............................................................ 5% 4%
Latin America............................................................. 7% 10%
Total .................................................................... 100% 100%
The 10 markets in which we generated the greatest net sales in 2009 were, in descending order of
magnitude, China, India, the United Kingdom, Germany, the United States, Russia, Indonesia, Spain,
Brazil and Italy, together representing approximately 52% of our total net sales in 2009. In
comparison, the 10 markets in which we generated the greatest net sales in 2008 were China, India,
the UK, Germany, Russia, Indonesia, the US, Brazil, Italy and Spain, together representing
approximately 50% of our total net sales in 2008.
Our gross margin in 2009 was 32.4% compared with 34.3% in 2008. The lower gross margin in 2009
resulted primarily from the decrease in net sales compared to 2008.
Research and development, or R&D, expenses were EUR 5 909 million, down 1% from EUR 5
968 million in 2008. R&D expenses represented 14.4% of our net sales in 2009, up from 11.8% in
2008. The increase in R&D as a percentage of net sales reflected a decrease in net sales in Devices &
Services and Nokia Siemens Networks which was partially offset by a decrease in R&D expenses in
Devices & Services and Nokia Siemens Networks. In 2009, R&D expenses included restructuring
110