Nokia 2010 Annual Report Download - page 228
Download and view the complete annual report
Please find page 228 of the 2010 Nokia annual report below. You can navigate through the pages in the report by either clicking on the pages listed below, or by using the keyword search tool below to find specific information within the annual report.-
 1
1 -
2
-
3
-
4
-
5
-
6
-
7
-
8
-
9
-
10
-
11
-
12
-
13
-
14
-
15
-
16
-
17
-
18
-
19
-
20
-
21
-
22
-
23
-
24
-
25
-
26
-
27
-
28
-
29
-
30
-
31
-
32
-
33
-
34
-
35
-
36
-
37
-
38
-
39
-
40
-
41
-
42
-
43
-
44
-
45
-
46
-
47
-
48
-
49
-
50
-
51
-
52
-
53
-
54
-
55
-
56
-
57
-
58
-
59
-
60
-
61
-
62
-
63
-
64
-
65
-
66
-
67
-
68
-
69
-
70
-
71
-
72
-
73
-
74
-
75
-
76
-
77
-
78
-
79
-
80
-
81
-
82
-
83
-
84
-
85
-
86
-
87
-
88
-
89
-
90
-
91
-
92
-
93
-
94
-
95
-
96
-
97
-
98
-
99
-
100
-
101
-
102
-
103
-
104
-
105
-
106
-
107
-
108
-
109
-
110
-
111
-
112
-
113
-
114
-
115
-
116
-
117
-
118
-
119
-
120
-
121
-
122
-
123
-
124
-
125
-
126
-
127
-
128
-
129
-
130
-
131
-
132
-
133
-
134
-
135
-
136
-
137
-
138
-
139
-
140
-
141
-
142
-
143
-
144
-
145
-
146
-
147
-
148
-
149
-
150
-
151
-
152
-
153
-
154
-
155
-
156
-
157
-
158
-
159
-
160
-
161
-
162
-
163
-
164
-
165
-
166
-
167
-
168
-
169
-
170
-
171
-
172
-
173
-
174
-
175
-
176
-
177
-
178
-
179
-
180
-
181
-
182
-
183
-
184
-
185
-
186
-
187
-
188
-
189
-
190
-
191
-
192
-
193
-
194
-
195
-
196
-
197
-
198
-
199
-
200
-
201
-
202
-
203
-
204
-
205
-
206
-
207
-
208
-
209
-
210
-
211
-
212
-
213
-
214
-
215
-
216
-
217
-
 218
218 -
 219
219 -
 220
220 -
 221
221 -
 222
222 -
 223
223 -
 224
224 -
 225
225 -
 226
226 -
 227
227 -
 228
228 -
 229
229 -
 230
230 -
 231
231 -
 232
232 -
 233
233 -
 234
234 -
 235
235 -
 236
236 -
 237
237 -
 238
238 -
239
-
240
-
241
-
242
-
243
-
244
-
245
-
246
-
247
-
248
-
249
-
250
-
251
-
252
-
253
-
254
-
255
-
256
-
257
-
258
-
259
-
260
-
261
-
262
-
263
-
264
-
265
-
266
-
267
-
268
-
269
-
270
-
271
-
272
-
273
-
274
-
275
 |
 |

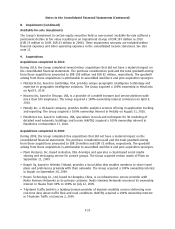
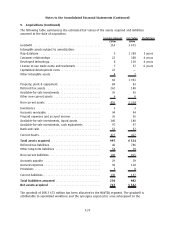
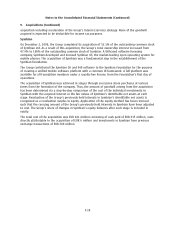
9. Acquisitions (Continued)
and the total goodwill arising from these acquisitions amounted to EUR 514 million and
EUR 339 million, respectively. The goodwill arising from these acquisitions is attributable to
assembled workforce and post acquisition synergies.
• Trolltech ASA, based in Oslo, Norway, is a recognised software provider with worldclass software
development platforms and frameworks. The Group acquired a 100% ownership interest in
Trolltech ASA on 6 June 2008.
• Oz Communications Inc., headquartered in Montreal, Canada, is a leading consumer mobile
messaging solution provider delivering access to popular instant messaging and email services on
consumer mobile devices. The Group acquired a 100% ownership interest in Oz Communications
Inc. on 4 November 2008.
• Atrica, based in Santa Clara, USA, is one of the leading providers of Carrier Ethernet solutions for
Metropolitan Area Networks. Nokia Siemens Networks acquired a 100% ownership interest in Atrica
on 7 January 2008.
• Apertio Ltd, based in Bristol, England is the leading independent provider of subscribercentric
networks for mobile, fixed and converged telecommunications operators. Nokia Siemens Networks
acquired a 100% ownership interest in Apertio Ltd on 11 February 2008.
• On January 1, 2008, Nokia Siemens Networks assumed control of Vivento Technical Services from
Deutsche Telekom.
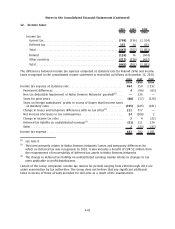
10. Depreciation and amortization
2010 2009 2008
EURm EURm EURm
Depreciation and amortization by function
Cost of sales . . .................................................. 248 266 297
Research and development
(1)
....................................... 906 909 778
Selling and marketing
(2)
........................................... 426 424 368
Administrative and general......................................... 191 185 174
Total .......................................................... 1 771 1 784 1 617
(1)
In 2010, depreciation and amortization allocated to research and development included
amortization of acquired intangible assets of EUR 556 million (EUR 534 million in 2009 and EUR
351 million in 2008, respectively).
(2)
In 2010, depreciation and amortization allocated to selling and marketing included amortization
of acquired intangible assets of EUR 408 million (EUR 401 million in 2009 and EUR 343 million in
2008, respectively).
F40
Notes to the Consolidated Financial Statements (Continued)