Nokia 2010 Annual Report Download - page 120
Download and view the complete annual report
Please find page 120 of the 2010 Nokia annual report below. You can navigate through the pages in the report by either clicking on the pages listed below, or by using the keyword search tool below to find specific information within the annual report.-
 1
1 -
2
-
3
-
4
-
5
-
6
-
7
-
8
-
9
-
10
-
11
-
12
-
13
-
14
-
15
-
16
-
17
-
18
-
19
-
20
-
21
-
22
-
23
-
24
-
25
-
26
-
27
-
28
-
29
-
30
-
31
-
32
-
33
-
34
-
35
-
36
-
37
-
38
-
39
-
40
-
41
-
42
-
43
-
44
-
45
-
46
-
47
-
48
-
49
-
50
-
51
-
52
-
53
-
54
-
55
-
56
-
57
-
58
-
59
-
60
-
61
-
62
-
63
-
64
-
65
-
66
-
67
-
68
-
69
-
70
-
71
-
72
-
73
-
74
-
75
-
76
-
77
-
78
-
79
-
80
-
81
-
82
-
83
-
84
-
85
-
86
-
87
-
88
-
89
-
90
-
91
-
92
-
93
-
94
-
95
-
96
-
97
-
98
-
99
-
100
-
101
-
102
-
103
-
104
-
105
-
106
-
107
-
108
-
109
-
 110
110 -
 111
111 -
 112
112 -
 113
113 -
 114
114 -
 115
115 -
 116
116 -
 117
117 -
 118
118 -
 119
119 -
 120
120 -
 121
121 -
 122
122 -
 123
123 -
 124
124 -
 125
125 -
 126
126 -
 127
127 -
 128
128 -
 129
129 -
 130
130 -
131
-
132
-
133
-
134
-
135
-
136
-
137
-
138
-
139
-
140
-
141
-
142
-
143
-
144
-
145
-
146
-
147
-
148
-
149
-
150
-
151
-
152
-
153
-
154
-
155
-
156
-
157
-
158
-
159
-
160
-
161
-
162
-
163
-
164
-
165
-
166
-
167
-
168
-
169
-
170
-
171
-
172
-
173
-
174
-
175
-
176
-
177
-
178
-
179
-
180
-
181
-
182
-
183
-
184
-
185
-
186
-
187
-
188
-
189
-
190
-
191
-
192
-
193
-
194
-
195
-
196
-
197
-
198
-
199
-
200
-
201
-
202
-
203
-
204
-
205
-
206
-
207
-
208
-
209
-
210
-
211
-
212
-
213
-
214
-
215
-
216
-
217
-
218
-
219
-
220
-
221
-
222
-
223
-
224
-
225
-
226
-
227
-
228
-
229
-
230
-
231
-
232
-
233
-
234
-
235
-
236
-
237
-
238
-
239
-
240
-
241
-
242
-
243
-
244
-
245
-
246
-
247
-
248
-
249
-
250
-
251
-
252
-
253
-
254
-
255
-
256
-
257
-
258
-
259
-
260
-
261
-
262
-
263
-
264
-
265
-
266
-
267
-
268
-
269
-
270
-
271
-
272
-
273
-
274
-
275
 |
 |
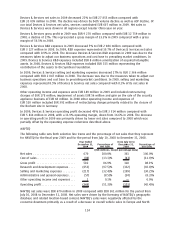
Proceeds from maturities and sale of current availableforsale investments, liquid assets, increased to
EUR 7 181 million, compared with EUR 1 730 million in 2009 and EUR 4 664 million in 2008. Net cash
used in financing activities increased to EUR 911 million in 2010, compared with EUR 696 million in
2009, primarily as a result of a change in the proceeds and payments of shortterm borrowings partly
offset by a decrease of proceeds from longterm borrowings. Net cash used in financing activities
increased to EUR 696 million in 2009, compared with EUR 1 545 million in 2008, primarily as a result
of a decrease in the share buybacks, an increase in longterm borrowings, and a decrease in
dividends paid partly offset by a decrease of shortterm borrowings. Dividends paid decreased to
EUR 1 519 million in 2010, compared with EUR 1 546 million in 2009 and EUR 2 048 million in 2008.
At December 31, 2010, we had EUR 4 242 million in longterm interestbearing liabilities and
EUR 1 037 million in shortterm borrowings, offset by EUR 12 275 million in cash and other liquid
assets, resulting in a net liquid assets balance of EUR 6 996 million, compared with EUR 3 670 million
at the end of 2009 and EUR 2 368 million at the end of 2008. The increase in net liquid assets in
2010 reflected positive operational cash flow partially offset by the dividend payment and capital
expenditures. For further information regarding our longterm liabilities, see Note 16 to our
consolidated financial statements included in Item 18 of this annual report. Our ratio of net interest
bearing debt, defined as shortterm and longterm debt less cash and other liquid assets, to equity,
defined as capital and reserves attributable to equity holders of the parent and noncontrolling
interests, was negative 43%, negative 25% and negative 14% at December 31, 2010, 2009 and 2008,
respectively.
Our Board of Directors has proposed a dividend of EUR 0.40 per share for the year ended
December 31, 2010, subject to the shareholders’ approval, compared with EUR 0.40 and EUR 0.40 per
share paid for the years ended December 31, 2009 and 2008, respectively. See Item 3A “Selected
Financial Data—Distribution of Earnings.”
We have no significant refinancing requirements in 2011. We may incur additional indebtedness from
time to time as required to finance acquisitions and working capital needs. In 2010, we did not raise
material new longterm debt. In February 2009, we issued EUR 1 750 million of Eurobonds
(EUR 1 250 million bonds due 2014 with a coupon of 5.50% and issue price of 99.855%; and
EUR 500 million bonds due 2019 with a coupon of 6.75% and issue price of 99.702%) under our Euro
MediumTerm Note, or EMTN, program to repay part of our shortterm borrowings. In February 2009,
we also signed and fully drew a EUR 500 million loan from the European Investment Bank. The
proceeds of the loan are being used to finance part of our smartphone research and development
expenses. In May 2009, we issued USD 1 500 million of US bonds (USD 1 000 million due in 2019 with
a coupon of 5.375% and issue price of 99.075%; and USD 500 million due in 2039 with a coupon of
6.625% and issue price of 99.494%) under our shelf registration statement on file with the US
Securities and Exchange Commission for general corporate purposes.
At December 31, 2010, we had a USD 4 000 million US Commercial Paper, or USCP, program,
USD 4 000 million Euro Commercial Paper, or ECP, program, domestic Finnish commercial paper
program totaling EUR 750 million and a shelf registration statement for an indeterminate amount of
debt securities on file with the US Securities and Exchange Commission. At December 31, 2010, we
also had committed credit facilities of USD 1 923 million maturing in 2012, and a number of short
term uncommitted facilities.
At December 31, 2010, Nokia Siemens Networks had a domestic Finnish commercial paper program
totaling EUR 500 million. Nokia Siemens Networks also had a committed revolving credit facility of
EUR 2 000 million maturing in 2012, which includes financial covenants related to gearing test,
leverage test and interest coverage test of Nokia Siemens Networks. As of December 31, 2010, all
financial covenants were satisfied. In 2010, the committed and drawn credit facility of
EUR 750 million maturing in 2013 was converted into equity.
In 2010, Nokia Siemens Networks drew a EUR 220 million Finnish pensions loan that will mature in
2015. In June 2009, Nokia Siemens Networks signed and fully drew a EUR 250 million loan from the
119