Nokia 2010 Annual Report Download - page 112
Download and view the complete annual report
Please find page 112 of the 2010 Nokia annual report below. You can navigate through the pages in the report by either clicking on the pages listed below, or by using the keyword search tool below to find specific information within the annual report.-
 1
1 -
2
-
3
-
4
-
5
-
6
-
7
-
8
-
9
-
10
-
11
-
12
-
13
-
14
-
15
-
16
-
17
-
18
-
19
-
20
-
21
-
22
-
23
-
24
-
25
-
26
-
27
-
28
-
29
-
30
-
31
-
32
-
33
-
34
-
35
-
36
-
37
-
38
-
39
-
40
-
41
-
42
-
43
-
44
-
45
-
46
-
47
-
48
-
49
-
50
-
51
-
52
-
53
-
54
-
55
-
56
-
57
-
58
-
59
-
60
-
61
-
62
-
63
-
64
-
65
-
66
-
67
-
68
-
69
-
70
-
71
-
72
-
73
-
74
-
75
-
76
-
77
-
78
-
79
-
80
-
81
-
82
-
83
-
84
-
85
-
86
-
87
-
88
-
89
-
90
-
91
-
92
-
93
-
94
-
95
-
96
-
97
-
98
-
99
-
100
-
101
-
 102
102 -
 103
103 -
 104
104 -
 105
105 -
 106
106 -
 107
107 -
 108
108 -
 109
109 -
 110
110 -
 111
111 -
 112
112 -
 113
113 -
 114
114 -
 115
115 -
 116
116 -
 117
117 -
 118
118 -
 119
119 -
 120
120 -
 121
121 -
 122
122 -
123
-
124
-
125
-
126
-
127
-
128
-
129
-
130
-
131
-
132
-
133
-
134
-
135
-
136
-
137
-
138
-
139
-
140
-
141
-
142
-
143
-
144
-
145
-
146
-
147
-
148
-
149
-
150
-
151
-
152
-
153
-
154
-
155
-
156
-
157
-
158
-
159
-
160
-
161
-
162
-
163
-
164
-
165
-
166
-
167
-
168
-
169
-
170
-
171
-
172
-
173
-
174
-
175
-
176
-
177
-
178
-
179
-
180
-
181
-
182
-
183
-
184
-
185
-
186
-
187
-
188
-
189
-
190
-
191
-
192
-
193
-
194
-
195
-
196
-
197
-
198
-
199
-
200
-
201
-
202
-
203
-
204
-
205
-
206
-
207
-
208
-
209
-
210
-
211
-
212
-
213
-
214
-
215
-
216
-
217
-
218
-
219
-
220
-
221
-
222
-
223
-
224
-
225
-
226
-
227
-
228
-
229
-
230
-
231
-
232
-
233
-
234
-
235
-
236
-
237
-
238
-
239
-
240
-
241
-
242
-
243
-
244
-
245
-
246
-
247
-
248
-
249
-
250
-
251
-
252
-
253
-
254
-
255
-
256
-
257
-
258
-
259
-
260
-
261
-
262
-
263
-
264
-
265
-
266
-
267
-
268
-
269
-
270
-
271
-
272
-
273
-
274
-
275
 |
 |

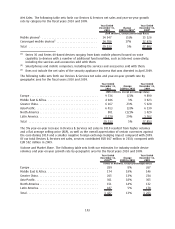
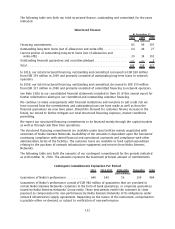
charges of EUR 30 million and purchase price accounting related items of EUR 534 million. In 2008,
R&D expenses included EUR 153 million representing the contribution of the assets to the Symbian
Foundation, restructuring charges of EUR 46 million and purchase price accounting related items of
EUR 351 million.
In 2009, selling and marketing expenses were EUR 3 933 million compared with EUR 4 380 million in
2008. Selling and marketing expenses represented 9.6% of our net sales in 2009, up from 8.6% in
2008. The increase in selling and marketing expenses as a percentage of net sales reflected a
decrease in net sales in Devices & Services and Nokia Siemens Networks which was partially offset by
a decrease in sales and marketing expenses in Devices & Services. In 2009, selling and marketing
expenses included restructuring charges of EUR 12 million and EUR 401 million of purchase price
accounting related items. In 2008, selling and marketing expenses included a EUR 14 million reversal
of restructuring charges and EUR 343 million of purchase price accounting related items.
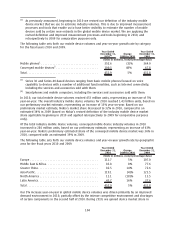
Administrative and general expenses were EUR 1 145 million in 2009 and EUR 1 284 million in 2008.
Administrative and general expenses were 2.8% of net sales in 2009 compared to 2.5% in 2008.
Administrative and general expenses in 2009 included restructuring charges of EUR 103 million.
Administrative and general expenses for 2008 also included restructuring charges of EUR 163 million.
In 2009, other income and expenses included restructuring charges of EUR 192 million, purchase price
accounting related items of EUR 5 million, impairment of goodwill related to Nokia Siemens Networks
of EUR 908 million, impairment of assets of EUR 56 million, a gain on sale of the security appliance
business of EUR 68 million and a gain on sale of real estate of EUR 22 million in 2009. In 2008, other
operating income and expenses included restructuring charges of EUR 446 million and
EUR 152 million loss due to transfer of the Finnish pension liabilities to pension insurance companies.
Our operating profit for 2009 decreased 76% to EUR 1 197 million compared with EUR 4 966 million
in 2008. The decreased operating profit resulted from decreased profitability of all reportable
segments. Our operating margin was 2.9% in 2009 compared with 9.8% in 2008.
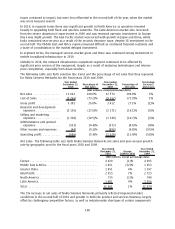
Results by Segments
Devices & Services
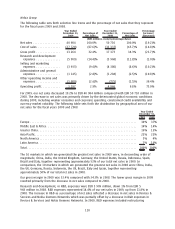
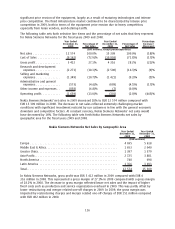
The following table sets forth our estimates for industry mobile device volumes and yearonyear
growth rate by geographic area for the fiscal years 2009 and 2008. These estimates and the following
discussion are based on our definition of the industry mobile device market used in 2009 and 2008.
Year Ended
December 31,
2009
(1)
Change
2008 to 2009
Year Ended
December 31,
2008
(Units in millions, except percentage data)
Europe .......................................... 252 (10)% 281
Middle East & Africa ................................ 137 (8)% 149
Greater China ..................................... 188 3% 183
AsiaPacific. . ..................................... 275 (3)% 284
North America .................................... 172 (3)% 178
Latin America..................................... 115 (17)% 139
Total ............................................ 1140 (6)% 1 213
(1)
Beginning in 2010, we revised our definition of the industry mobile device market that we use to
estimate industry volumes. This was due to improved measurement processes and tools that
enabled us to have better visibility to estimate the number of mobile devices sold by certain new
entrants in the global mobile device market. These included vendors of legitimate, as well as
unlicensed and counterfeit, products with manufacturing facilities primarily centered around
111