Nokia 2010 Annual Report Download - page 75
Download and view the complete annual report
Please find page 75 of the 2010 Nokia annual report below. You can navigate through the pages in the report by either clicking on the pages listed below, or by using the keyword search tool below to find specific information within the annual report.-
 1
1 -
2
-
3
-
4
-
5
-
6
-
7
-
8
-
9
-
10
-
11
-
12
-
13
-
14
-
15
-
16
-
17
-
18
-
19
-
20
-
21
-
22
-
23
-
24
-
25
-
26
-
27
-
28
-
29
-
30
-
31
-
32
-
33
-
34
-
35
-
36
-
37
-
38
-
39
-
40
-
41
-
42
-
43
-
44
-
45
-
46
-
47
-
48
-
49
-
50
-
51
-
52
-
53
-
54
-
55
-
56
-
57
-
58
-
59
-
60
-
61
-
62
-
63
-
64
-
 65
65 -
 66
66 -
 67
67 -
 68
68 -
 69
69 -
 70
70 -
 71
71 -
 72
72 -
 73
73 -
 74
74 -
 75
75 -
 76
76 -
 77
77 -
 78
78 -
 79
79 -
 80
80 -
 81
81 -
 82
82 -
 83
83 -
 84
84 -
 85
85 -
86
-
87
-
88
-
89
-
90
-
91
-
92
-
93
-
94
-
95
-
96
-
97
-
98
-
99
-
100
-
101
-
102
-
103
-
104
-
105
-
106
-
107
-
108
-
109
-
110
-
111
-
112
-
113
-
114
-
115
-
116
-
117
-
118
-
119
-
120
-
121
-
122
-
123
-
124
-
125
-
126
-
127
-
128
-
129
-
130
-
131
-
132
-
133
-
134
-
135
-
136
-
137
-
138
-
139
-
140
-
141
-
142
-
143
-
144
-
145
-
146
-
147
-
148
-
149
-
150
-
151
-
152
-
153
-
154
-
155
-
156
-
157
-
158
-
159
-
160
-
161
-
162
-
163
-
164
-
165
-
166
-
167
-
168
-
169
-
170
-
171
-
172
-
173
-
174
-
175
-
176
-
177
-
178
-
179
-
180
-
181
-
182
-
183
-
184
-
185
-
186
-
187
-
188
-
189
-
190
-
191
-
192
-
193
-
194
-
195
-
196
-
197
-
198
-
199
-
200
-
201
-
202
-
203
-
204
-
205
-
206
-
207
-
208
-
209
-
210
-
211
-
212
-
213
-
214
-
215
-
216
-
217
-
218
-
219
-
220
-
221
-
222
-
223
-
224
-
225
-
226
-
227
-
228
-
229
-
230
-
231
-
232
-
233
-
234
-
235
-
236
-
237
-
238
-
239
-
240
-
241
-
242
-
243
-
244
-
245
-
246
-
247
-
248
-
249
-
250
-
251
-
252
-
253
-
254
-
255
-
256
-
257
-
258
-
259
-
260
-
261
-
262
-
263
-
264
-
265
-
266
-
267
-
268
-
269
-
270
-
271
-
272
-
273
-
274
-
275
 |
 |

Nokia (including NAVTEQ) caused 59 800 tons of waste in 2010. Out of this, 91% was reused or
recycled, energy was recovered from 4% and only 5% went for final disposal,
i.e.
, either for landfill or
was incinerated without energy recovery.
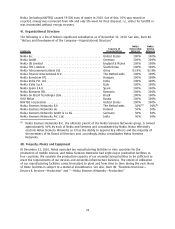
4C. Organizational Structure
The following is a list of Nokia’s significant subsidiaries as of December 31, 2010. See also, Item 4A.
“History and Development of the Company—Organizational Structure”.
Company
Country of
Incorporation
Nokia
Ownership
Interest
Nokia
Voting
Interest
Nokia Inc. ......................................... United States 100% 100%
Nokia GmbH ....................................... Germany 100% 100%
Nokia UK Limited ................................... England & Wales 100% 100%
Nokia TMC Limited .................................. South Korea 100% 100%
Nokia Telecommunications Ltd. ........................ China 83.9% 83.9%
Nokia Finance International B.V. ....................... TheNetherlands 100% 100%
Nokia Komárom Kft .................................. Hungary 100% 100%
Nokia India Pvt. Ltd. ................................. India 100% 100%
Nokia Italia S.p.A .................................... Italy 100% 100%
Nokia Spain S.A.U. .................................. Spain 100% 100%
Nokia Romania SRL .................................. Romania 100% 100%
Nokia do Brasil Tecnologia Ltda ........................ Brazil 100% 100%
OOO Nokia ......................................... Russia 100% 100%
NAVTEQ Corporation ................................. United States 100% 100%
Nokia Siemens Networks B.V. ......................... TheNetherlands 50%
(1)
50%
(1)
Nokia Siemens Networks Oy ........................... Finland 50% 50%
Nokia Siemens Networks GmbH & Co KG ................. Germany 50% 50%
Nokia Siemens Networks Pvt. Ltd. ...................... India 50% 50%
(1)
Nokia Siemens Networks B.V., the ultimate parent of the Nokia Siemens Networks group, is owned
approximately 50% by each of Nokia and Siemens and consolidated by Nokia. Nokia effectively
controls Nokia Siemens Networks as it has the ability to appoint key officers and the majority of
the members of its Board of Directors and, accordingly, Nokia consolidates Nokia Siemens
Networks.
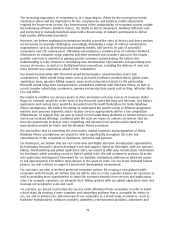
4D. Property, Plants and Equipment
At December 31, 2010, Nokia operated ten manufacturing facilities in nine countries for the
production of mobile devices, and Nokia Siemens Networks had eight major production facilities in
four countries. We consider the production capacity of our manufacturing facilities to be sufficient to
meet the requirements of our devices and networks infrastructure business. The extent of utilization
of our manufacturing facilities varies from plant to plant and from time to time during the year. None
of these facilities is subject to a material encumbrance. See also, Item 4B. “Business Overview—
Devices & Services—Production” and “—Nokia Siemens Networks—Production.”
74