Nokia 2010 Annual Report Download - page 110
Download and view the complete annual report
Please find page 110 of the 2010 Nokia annual report below. You can navigate through the pages in the report by either clicking on the pages listed below, or by using the keyword search tool below to find specific information within the annual report.-
 1
1 -
2
-
3
-
4
-
5
-
6
-
7
-
8
-
9
-
10
-
11
-
12
-
13
-
14
-
15
-
16
-
17
-
18
-
19
-
20
-
21
-
22
-
23
-
24
-
25
-
26
-
27
-
28
-
29
-
30
-
31
-
32
-
33
-
34
-
35
-
36
-
37
-
38
-
39
-
40
-
41
-
42
-
43
-
44
-
45
-
46
-
47
-
48
-
49
-
50
-
51
-
52
-
53
-
54
-
55
-
56
-
57
-
58
-
59
-
60
-
61
-
62
-
63
-
64
-
65
-
66
-
67
-
68
-
69
-
70
-
71
-
72
-
73
-
74
-
75
-
76
-
77
-
78
-
79
-
80
-
81
-
82
-
83
-
84
-
85
-
86
-
87
-
88
-
89
-
90
-
91
-
92
-
93
-
94
-
95
-
96
-
97
-
98
-
99
-
 100
100 -
 101
101 -
 102
102 -
 103
103 -
 104
104 -
 105
105 -
 106
106 -
 107
107 -
 108
108 -
 109
109 -
 110
110 -
 111
111 -
 112
112 -
 113
113 -
 114
114 -
 115
115 -
 116
116 -
 117
117 -
 118
118 -
 119
119 -
 120
120 -
121
-
122
-
123
-
124
-
125
-
126
-
127
-
128
-
129
-
130
-
131
-
132
-
133
-
134
-
135
-
136
-
137
-
138
-
139
-
140
-
141
-
142
-
143
-
144
-
145
-
146
-
147
-
148
-
149
-
150
-
151
-
152
-
153
-
154
-
155
-
156
-
157
-
158
-
159
-
160
-
161
-
162
-
163
-
164
-
165
-
166
-
167
-
168
-
169
-
170
-
171
-
172
-
173
-
174
-
175
-
176
-
177
-
178
-
179
-
180
-
181
-
182
-
183
-
184
-
185
-
186
-
187
-
188
-
189
-
190
-
191
-
192
-
193
-
194
-
195
-
196
-
197
-
198
-
199
-
200
-
201
-
202
-
203
-
204
-
205
-
206
-
207
-
208
-
209
-
210
-
211
-
212
-
213
-
214
-
215
-
216
-
217
-
218
-
219
-
220
-
221
-
222
-
223
-
224
-
225
-
226
-
227
-
228
-
229
-
230
-
231
-
232
-
233
-
234
-
235
-
236
-
237
-
238
-
239
-
240
-
241
-
242
-
243
-
244
-
245
-
246
-
247
-
248
-
249
-
250
-
251
-
252
-
253
-
254
-
255
-
256
-
257
-
258
-
259
-
260
-
261
-
262
-
263
-
264
-
265
-
266
-
267
-
268
-
269
-
270
-
271
-
272
-
273
-
274
-
275
 |
 |
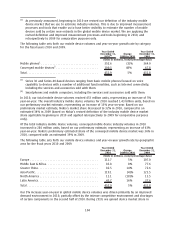
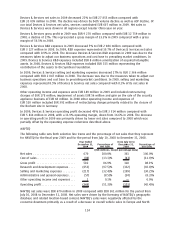
and security clearances issues in India preventing the completion of product sales to customers
during the second and third quarters of 2010. Of total Nokia Siemens Networks net sales, services
contributed EUR 5.8 billion in 2010 (EUR 5.7 billion in 2009). Europe accounted for 37% (37%) of
Nokia Siemens Network’s net sales, AsiaPacific 23% (22%), Middle East & Africa 11% (13%), Latin
America 12% (11%), Greater China 11% (11%) and North America 6% (6%) in 2010 (2009).
Profitability.
Nokia Siemens Networks gross profit decreased to EUR 3 395 million in 2010, compared
with EUR 3 412 million in 2009, with a gross margin of 26.8% (27.1% in 2009). The yearonyear
decline in gross margin was primarily due to general price pressure on certain products, a higher
proportion of lower margin products in the business mix and shortages of certain components during
the second and third quarters of 2010, offset to some extent by progress on product cost reductions
and a more favorable regional mix compared to 2009.
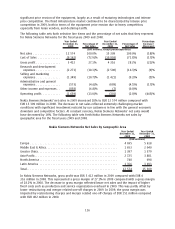
In Nokia Siemens Networks, R&D expenses decreased to EUR 2 156 million in 2010, compared with
EUR 2 271 million in 2009. In 2010, R&D expenses represented 17.0% of Nokia Siemens Networks net
sales, compared with 18.1% in 2010. The decrease in R&D expenses resulted largely from a higher
proportion of R&D activities being conducted in emerging markets. In 2010, R&D expenses included
restructuring charges and other items of EUR 19 million (EUR 30 million in 2009) and purchase price
accounting related items of EUR 180 million (EUR 180 million in 2009).
In 2010, Nokia Siemens Networks’ selling and marketing expenses decreased to EUR 1 328 million,
compared with EUR 1 349 million in 2009. Nokia Siemens Networks’ selling and marketing expenses
represented 10.5% of its net sales in 2009, compared to 10.7% in 2009. The slight reduction in
selling and marketing expenses was related to ongoing restructuring and measures to reduce
discretionary expenditure. In 2010, selling and marketing expenses included restructuring charges of
EUR 21 million (EUR 12 million in 2009) and purchase price accounting related items of
EUR 285 million (EUR 286 million in 2009).
In 2010, other operating expenses of EUR 44 million included restructuring charges of EUR 27 million.
In 2009, other operating income and expenses included an impairment of goodwill of EUR 908 million
in the third quarter of 2009 due to a decline in forecasted profits and cash flows as a result of
challenging competitive factors and market conditions in the infrastructure and related service
business. In addition, other operating income and expenses in 2009 included a restructuring charge
and other items of EUR 14 million, purchase price accounting related items of EUR 5 million and a
gain of EUR 22 million on the sale of real estate.
Nokia Siemens Networks had an operating loss of EUR 686 million in 2010, compared with an
operating loss of EUR 1.6 billion in 2009. The operating margin of Nokia Siemens Networks in 2010
was 5.4% compared with 13.0% in 2009. The operating loss decrease in 2010 resulted primarily
from the absence of goodwill charges in 2010, compared to the EUR 908 million impairment of
goodwill in 2009, higher net sales and lower operating expenses, the impact of which was partially
offset by the lower gross margin.
2009 compared with 2008
Nokia completed the acquisition of NAVTEQ Corporation on July 10, 2008. NAVTEQ is a separate
reportable segment of Nokia starting from the third quarter 2008. The results of NAVTEQ are not
available for the prior periods. Accordingly, the results of Nokia Group and NAVTEQ for the full year
2009 are not directly comparable to the results for the full year 2008.
109