Nokia 2010 Annual Report Download - page 162
Download and view the complete annual report
Please find page 162 of the 2010 Nokia annual report below. You can navigate through the pages in the report by either clicking on the pages listed below, or by using the keyword search tool below to find specific information within the annual report.-
 1
1 -
2
-
3
-
4
-
5
-
6
-
7
-
8
-
9
-
10
-
11
-
12
-
13
-
14
-
15
-
16
-
17
-
18
-
19
-
20
-
21
-
22
-
23
-
24
-
25
-
26
-
27
-
28
-
29
-
30
-
31
-
32
-
33
-
34
-
35
-
36
-
37
-
38
-
39
-
40
-
41
-
42
-
43
-
44
-
45
-
46
-
47
-
48
-
49
-
50
-
51
-
52
-
53
-
54
-
55
-
56
-
57
-
58
-
59
-
60
-
61
-
62
-
63
-
64
-
65
-
66
-
67
-
68
-
69
-
70
-
71
-
72
-
73
-
74
-
75
-
76
-
77
-
78
-
79
-
80
-
81
-
82
-
83
-
84
-
85
-
86
-
87
-
88
-
89
-
90
-
91
-
92
-
93
-
94
-
95
-
96
-
97
-
98
-
99
-
100
-
101
-
102
-
103
-
104
-
105
-
106
-
107
-
108
-
109
-
110
-
111
-
112
-
113
-
114
-
115
-
116
-
117
-
118
-
119
-
120
-
121
-
122
-
123
-
124
-
125
-
126
-
127
-
128
-
129
-
130
-
131
-
132
-
133
-
134
-
135
-
136
-
137
-
138
-
139
-
140
-
141
-
142
-
143
-
144
-
145
-
146
-
147
-
148
-
149
-
150
-
151
-
 152
152 -
 153
153 -
 154
154 -
 155
155 -
 156
156 -
 157
157 -
 158
158 -
 159
159 -
 160
160 -
 161
161 -
 162
162 -
 163
163 -
 164
164 -
 165
165 -
 166
166 -
 167
167 -
 168
168 -
 169
169 -
 170
170 -
 171
171 -
 172
172 -
173
-
174
-
175
-
176
-
177
-
178
-
179
-
180
-
181
-
182
-
183
-
184
-
185
-
186
-
187
-
188
-
189
-
190
-
191
-
192
-
193
-
194
-
195
-
196
-
197
-
198
-
199
-
200
-
201
-
202
-
203
-
204
-
205
-
206
-
207
-
208
-
209
-
210
-
211
-
212
-
213
-
214
-
215
-
216
-
217
-
218
-
219
-
220
-
221
-
222
-
223
-
224
-
225
-
226
-
227
-
228
-
229
-
230
-
231
-
232
-
233
-
234
-
235
-
236
-
237
-
238
-
239
-
240
-
241
-
242
-
243
-
244
-
245
-
246
-
247
-
248
-
249
-
250
-
251
-
252
-
253
-
254
-
255
-
256
-
257
-
258
-
259
-
260
-
261
-
262
-
263
-
264
-
265
-
266
-
267
-
268
-
269
-
270
-
271
-
272
-
273
-
274
-
275
 |
 |

Mr. Simonson, as at September 20, 2010 of EUR 7.87 in respect of Mr. Kallasvuo and as at
October 12, 2010 of EUR 7.86 in respect of Mr. Vanjoki.
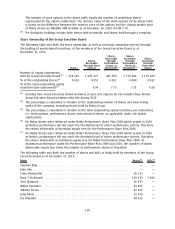
Performance Shares and Restricted Shares
The following table provides certain information relating to performance shares and restricted shares
held by members of the Group Executive Board as at December 31, 2010. These entitlements were
granted pursuant to our Performance Share Plans 2008, 2009 and 2010 and Restricted Share Plans
2007, 2008, 2009 and 2010. For a description of our performance share and restricted share plans,
please see Note 24 to the consolidated financial statements in Item 18 of this annual report.
Name Plan Name
(1)
Number of
Performance
Shares at
Threshold
(2)
Number of
Performance
Shares at
Maximum
(3)
Intrinsic Value
December 31,
2010
(4)
(EUR)
Plan
Name
(5)
Number of
Restricted
Shares
Intrinsic Value
December 31,
2010
(6)
(EUR)
Performance Shares Restricted Shares
Stephen Elop .......... 2010 75 000 300 000 1 161 000 2010 100 000 774 000
EskoAho ............ 2008 — — — 2008 7 000 54 180
2009 17 500 70 000 102 224 2009 25 000 193 500
2010 15 000 60 000 232 200 2010 58 000 448 920
Timo Ihamuotila ....... 2008 0 0 0 2008 14 000 108 360
2009 27 500 110 000 160 638 2009 35 000 270 900
2010 35 000 140 000 541 800 2010 120 000 928 800
Mary T. McDowell ....... 2008 0 0 0 2008 20 000 154 800
2009 27 500 110 000 160 638 2009 38 000 294 120
2010 30 000 120 000 464 400 2010 115 000 890 100
Tero Ojanpera
¨......... 2008 0 0 0 2008 14 000 108 360
2009 17 500 70 000 102 224 2009 25 000 193 500
2010 20 000 80 000 309 600 2010 85 000 657 900
Niklas Savander ........ 2008 0 0 0 2008 20 000 154 800
2009 27 500 110 000 160 638 2009 38 000 294 120
2010 30 000 120 000 464 400 2010 115 000 890 100
Alberto Torres
(7)
........ 2008 0 0 0 2007 13 000 100 620
2009 10 000 40 000 58 414 2008 10 000 77 400
2010 20 000 80 000 309 600 2009 25 000 193 500
2010 30 000 232 200
Juha A
¨kra
¨s ........... 2008 0 0 0 2007 4 000 30 960
2009 6 000 24 000 35 048 2008 8 000 61 920
2010 20 000 80 000 309 600 2009 15 000 116 100
2010 85 000 657 900
Kai O
¨ista
¨mo
¨.......... 2008 0 0 0 2008 22 000 170 280
2009 30 000 120 000 175 241 2009 50 000 387 000
2010 35 000 140 000 541 800 2010 100 000 774 000
Performance shares and
restricted shares held by
the Group Executive Board,
Total
(8)
.............. 443500 1774000 5289465 1191000 9218340
All outstanding
performance shares and
restricted shares (global
plans), Total .......... 5720123
(13)
22 880 492
(14)
64 755 163 12 359 896 95 665 595
(1)
The performance period for the 2008 plan is 20082010, for the 2009 plan 20092011 and for
the 2010 plan 20102012, respectively.
(2)
The threshold number will vest as Nokia shares should the predetermined threshold
performance levels be met of both performance criteria. No Nokia shares were delivered under
the Performance Share Plan 2008 which would have vested in 2010 as Nokia’s performance did
not reach the threshold level of either performance criteria. Therefore the shares deliverable at
threshold equals zero for the Performance Share Plan 2008.
(3)
The maximum number will vest as Nokia shares should the predetermined maximum
performance levels be met of both performance criteria. The maximum number of performance
shares equals four times the number at threshold. No Nokia shares were delivered under the
161