Nokia 2010 Annual Report Download - page 255
Download and view the complete annual report
Please find page 255 of the 2010 Nokia annual report below. You can navigate through the pages in the report by either clicking on the pages listed below, or by using the keyword search tool below to find specific information within the annual report.-
 1
1 -
2
-
3
-
4
-
5
-
6
-
7
-
8
-
9
-
10
-
11
-
12
-
13
-
14
-
15
-
16
-
17
-
18
-
19
-
20
-
21
-
22
-
23
-
24
-
25
-
26
-
27
-
28
-
29
-
30
-
31
-
32
-
33
-
34
-
35
-
36
-
37
-
38
-
39
-
40
-
41
-
42
-
43
-
44
-
45
-
46
-
47
-
48
-
49
-
50
-
51
-
52
-
53
-
54
-
55
-
56
-
57
-
58
-
59
-
60
-
61
-
62
-
63
-
64
-
65
-
66
-
67
-
68
-
69
-
70
-
71
-
72
-
73
-
74
-
75
-
76
-
77
-
78
-
79
-
80
-
81
-
82
-
83
-
84
-
85
-
86
-
87
-
88
-
89
-
90
-
91
-
92
-
93
-
94
-
95
-
96
-
97
-
98
-
99
-
100
-
101
-
102
-
103
-
104
-
105
-
106
-
107
-
108
-
109
-
110
-
111
-
112
-
113
-
114
-
115
-
116
-
117
-
118
-
119
-
120
-
121
-
122
-
123
-
124
-
125
-
126
-
127
-
128
-
129
-
130
-
131
-
132
-
133
-
134
-
135
-
136
-
137
-
138
-
139
-
140
-
141
-
142
-
143
-
144
-
145
-
146
-
147
-
148
-
149
-
150
-
151
-
152
-
153
-
154
-
155
-
156
-
157
-
158
-
159
-
160
-
161
-
162
-
163
-
164
-
165
-
166
-
167
-
168
-
169
-
170
-
171
-
172
-
173
-
174
-
175
-
176
-
177
-
178
-
179
-
180
-
181
-
182
-
183
-
184
-
185
-
186
-
187
-
188
-
189
-
190
-
191
-
192
-
193
-
194
-
195
-
196
-
197
-
198
-
199
-
200
-
201
-
202
-
203
-
204
-
205
-
206
-
207
-
208
-
209
-
210
-
211
-
212
-
213
-
214
-
215
-
216
-
217
-
218
-
219
-
220
-
221
-
222
-
223
-
224
-
225
-
226
-
227
-
228
-
229
-
230
-
231
-
232
-
233
-
234
-
235
-
236
-
237
-
238
-
239
-
240
-
241
-
242
-
243
-
244
-
 245
245 -
 246
246 -
 247
247 -
 248
248 -
 249
249 -
 250
250 -
 251
251 -
 252
252 -
 253
253 -
 254
254 -
 255
255 -
 256
256 -
 257
257 -
 258
258 -
 259
259 -
 260
260 -
 261
261 -
 262
262 -
 263
263 -
 264
264 -
 265
265 -
266
-
267
-
268
-
269
-
270
-
271
-
272
-
273
-
274
-
275
 |
 |

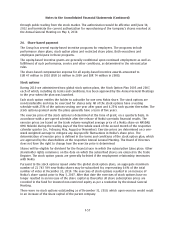
28. Earnings per share (Continued)
Under IAS 33, basic earnings per share is computed using the weighted average number of shares
outstanding during the period. Diluted earnings per share is computed using the weighted average
number of shares outstanding during the period plus the dilutive effect of stock options, restricted
shares and performance shares outstanding during the period.
In 2010, stock options equivalent to 13 million shares (12 million in 2009 and 11 million in
2008) were excluded from the calculation of diluted earnings per share because they were
determined to be antidilutive. In addition, 1 million of performance shares were excluded in 2010
from the calculation of dilutive shares because contingency conditions have not been met.
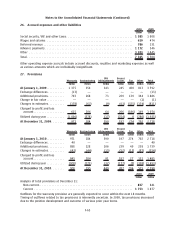
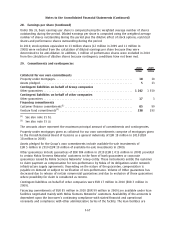
29. Commitments and contingencies
2010 2009
EURm EURm
Collateral for our own commitments
Property under mortgages ................................................ 18 18
Assets pledged ......................................................... 513
Contingent liabilities on behalf of Group companies
Other guarantees . . ..................................................... 1 262 1 350
Contingent liabilities on behalf of other companies
Other guarantees . . ..................................................... 17 3
Financing commitments
Customer finance commitments
(1)
.......................................... 85 99
Venture fund commitments
(2)
............................................. 238 293
(1)
See also note 35 b).
(2)
See also note 35 a).
The amounts above represent the maximum principal amount of commitments and contingencies.
Property under mortgages given as collateral for our own commitments comprise of mortgages given
to the Finnish National Board of Customs as a general indemnity of EUR 18 million in 2010 (EUR
18 million in 2009).
Assets pledged for the Group’s own commitments include availableforsale investments of
EUR 5 million in 2010 (EUR 10 million of availableforsale investments in 2009).
Other guarantees include guarantees of EUR 984 million in 2010 (EUR 1 013 million in 2009) provided
to certain Nokia Siemens Networks’ customers in the form of bank guarantees or corporate
guarantees issued by Nokia Siemens Networks’ Group entity. These instruments entitle the customer
to claim payment as compensation for nonperformance by Nokia of its obligations under network
infrastructure supply agreements. Depending on the nature of the guarantee, compensation is
payable on demand or subject to verification of nonperformance. Volume of Other guarantees has
decreased due to release of certain commercial guarantees and due to exclusion of those guarantees
where possibility for claim is considered as remote.
Contingent liabilities on behalf of other companies were EUR 17 million in 2010 (EUR 3 million in
2009).
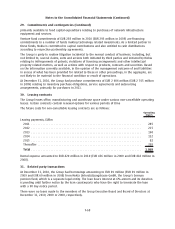
Financing commitments of EUR 85 million in 2010 (EUR 99 million in 2009) are available under loan
facilities negotiated mainly with Nokia Siemens Networks’ customers. Availability of the amounts is
dependent upon the borrower’s continuing compliance with stated financial and operational
covenants and compliance with other administrative terms of the facility. The loan facilities are
F67
Notes to the Consolidated Financial Statements (Continued)