Nokia 2010 Annual Report Download - page 267
Download and view the complete annual report
Please find page 267 of the 2010 Nokia annual report below. You can navigate through the pages in the report by either clicking on the pages listed below, or by using the keyword search tool below to find specific information within the annual report.-
 1
1 -
2
-
3
-
4
-
5
-
6
-
7
-
8
-
9
-
10
-
11
-
12
-
13
-
14
-
15
-
16
-
17
-
18
-
19
-
20
-
21
-
22
-
23
-
24
-
25
-
26
-
27
-
28
-
29
-
30
-
31
-
32
-
33
-
34
-
35
-
36
-
37
-
38
-
39
-
40
-
41
-
42
-
43
-
44
-
45
-
46
-
47
-
48
-
49
-
50
-
51
-
52
-
53
-
54
-
55
-
56
-
57
-
58
-
59
-
60
-
61
-
62
-
63
-
64
-
65
-
66
-
67
-
68
-
69
-
70
-
71
-
72
-
73
-
74
-
75
-
76
-
77
-
78
-
79
-
80
-
81
-
82
-
83
-
84
-
85
-
86
-
87
-
88
-
89
-
90
-
91
-
92
-
93
-
94
-
95
-
96
-
97
-
98
-
99
-
100
-
101
-
102
-
103
-
104
-
105
-
106
-
107
-
108
-
109
-
110
-
111
-
112
-
113
-
114
-
115
-
116
-
117
-
118
-
119
-
120
-
121
-
122
-
123
-
124
-
125
-
126
-
127
-
128
-
129
-
130
-
131
-
132
-
133
-
134
-
135
-
136
-
137
-
138
-
139
-
140
-
141
-
142
-
143
-
144
-
145
-
146
-
147
-
148
-
149
-
150
-
151
-
152
-
153
-
154
-
155
-
156
-
157
-
158
-
159
-
160
-
161
-
162
-
163
-
164
-
165
-
166
-
167
-
168
-
169
-
170
-
171
-
172
-
173
-
174
-
175
-
176
-
177
-
178
-
179
-
180
-
181
-
182
-
183
-
184
-
185
-
186
-
187
-
188
-
189
-
190
-
191
-
192
-
193
-
194
-
195
-
196
-
197
-
198
-
199
-
200
-
201
-
202
-
203
-
204
-
205
-
206
-
207
-
208
-
209
-
210
-
211
-
212
-
213
-
214
-
215
-
216
-
217
-
218
-
219
-
220
-
221
-
222
-
223
-
224
-
225
-
226
-
227
-
228
-
229
-
230
-
231
-
232
-
233
-
234
-
235
-
236
-
237
-
238
-
239
-
240
-
241
-
242
-
243
-
244
-
245
-
246
-
247
-
248
-
249
-
250
-
251
-
252
-
253
-
254
-
255
-
256
-
 257
257 -
 258
258 -
 259
259 -
 260
260 -
 261
261 -
 262
262 -
 263
263 -
 264
264 -
 265
265 -
 266
266 -
 267
267 -
 268
268 -
 269
269 -
 270
270 -
 271
271 -
 272
272 -
 273
273 -
 274
274 -
 275
275
 |
 |

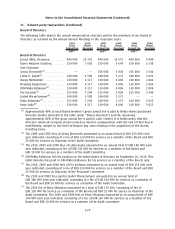
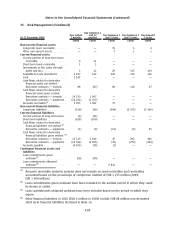
35. Risk Management (Continued)
Except as detailed in the following table, the maximum exposure to credit risk is limited to the book
value of the financial assets included in Group’s balance sheet:
2010 2009
EURm EURm
Financial guarantees given on behalf of customers and other third parties ........... ——
Loan commitments given but not used ....................................... 85 99
85 99
Business Related Credit Risk
The Company aims to ensure the highest possible quality in accounts receivable and loans due from
customers and other third parties. The Group Credit Policy, approved by Group Executive Board, lays
out the framework for the management of the business related credit risks in all Nokia group
companies.
Credit exposure is measured as the total of accounts receivable and loans outstanding due from
customers and other third parties, and committed credits.
Group Credit Policy provides that credit decisions are based on credit evaluation including credit
ratings for larger exposures. Nokia & Nokia Siemens Networks Rating Policy defines the rating
principles. Ratings are approved by Nokia & Nokia Siemens Networks Rating Committee. Credit risks
are approved and monitored according to the credit policy of each business entity. These policies are
based on the Group Credit Policy. Concentrations of customer or country risks are monitored at the
Nokia Group level. When appropriate, credit risks are mitigated with the use of approved instruments,
such as letters of credit, collateral or insurance and sale of selected receivables.
The accounts receivable do not include any major concentrations of credit risk by customer or by
geography. Top three customers account for approximately 2.2%, 2.1% and 2.1% (2009: 2.2%, 2.2%
and 1.9%) of Group accounts receivable and loans due from customers and other third parties as at
December 31, 2010, while the top three credit exposures by country amounted to 8.5%, 7.4% and
5.5% (2009: 7.2%, 6.5% and 5.6%), respectively.
The Group has provided allowances for doubtful accounts as needed on accounts receivable and loans
due from customers and other third parties not past due, based on the analysis of debtors’ credit
quality and credit history. The Group establishes allowances for doubtful accounts that represent an
estimate of incurred losses as of the end of the reporting period. All receivables and loans due from
customers and other third parties are considered on an individual basis in establishing the allowances
for doubtful accounts.
At December 31, 2010, the carrying amount before deducting any allowances for doubtful accounts
relating to customers for which an allowance was provided amounted to EUR 2 521 million (2009:
EUR 2 528 million). The amount of provision taken against that portion of these receivables
considered to be impaired was EUR 363 million (2009: EUR 391 million) (see also note 20 Valuation
and qualifying accounts).
F79
Notes to the Consolidated Financial Statements (Continued)