Nokia 2010 Annual Report Download - page 163
Download and view the complete annual report
Please find page 163 of the 2010 Nokia annual report below. You can navigate through the pages in the report by either clicking on the pages listed below, or by using the keyword search tool below to find specific information within the annual report.-
 1
1 -
2
-
3
-
4
-
5
-
6
-
7
-
8
-
9
-
10
-
11
-
12
-
13
-
14
-
15
-
16
-
17
-
18
-
19
-
20
-
21
-
22
-
23
-
24
-
25
-
26
-
27
-
28
-
29
-
30
-
31
-
32
-
33
-
34
-
35
-
36
-
37
-
38
-
39
-
40
-
41
-
42
-
43
-
44
-
45
-
46
-
47
-
48
-
49
-
50
-
51
-
52
-
53
-
54
-
55
-
56
-
57
-
58
-
59
-
60
-
61
-
62
-
63
-
64
-
65
-
66
-
67
-
68
-
69
-
70
-
71
-
72
-
73
-
74
-
75
-
76
-
77
-
78
-
79
-
80
-
81
-
82
-
83
-
84
-
85
-
86
-
87
-
88
-
89
-
90
-
91
-
92
-
93
-
94
-
95
-
96
-
97
-
98
-
99
-
100
-
101
-
102
-
103
-
104
-
105
-
106
-
107
-
108
-
109
-
110
-
111
-
112
-
113
-
114
-
115
-
116
-
117
-
118
-
119
-
120
-
121
-
122
-
123
-
124
-
125
-
126
-
127
-
128
-
129
-
130
-
131
-
132
-
133
-
134
-
135
-
136
-
137
-
138
-
139
-
140
-
141
-
142
-
143
-
144
-
145
-
146
-
147
-
148
-
149
-
150
-
151
-
152
-
 153
153 -
 154
154 -
 155
155 -
 156
156 -
 157
157 -
 158
158 -
 159
159 -
 160
160 -
 161
161 -
 162
162 -
 163
163 -
 164
164 -
 165
165 -
 166
166 -
 167
167 -
 168
168 -
 169
169 -
 170
170 -
 171
171 -
 172
172 -
 173
173 -
174
-
175
-
176
-
177
-
178
-
179
-
180
-
181
-
182
-
183
-
184
-
185
-
186
-
187
-
188
-
189
-
190
-
191
-
192
-
193
-
194
-
195
-
196
-
197
-
198
-
199
-
200
-
201
-
202
-
203
-
204
-
205
-
206
-
207
-
208
-
209
-
210
-
211
-
212
-
213
-
214
-
215
-
216
-
217
-
218
-
219
-
220
-
221
-
222
-
223
-
224
-
225
-
226
-
227
-
228
-
229
-
230
-
231
-
232
-
233
-
234
-
235
-
236
-
237
-
238
-
239
-
240
-
241
-
242
-
243
-
244
-
245
-
246
-
247
-
248
-
249
-
250
-
251
-
252
-
253
-
254
-
255
-
256
-
257
-
258
-
259
-
260
-
261
-
262
-
263
-
264
-
265
-
266
-
267
-
268
-
269
-
270
-
271
-
272
-
273
-
274
-
275
 |
 |

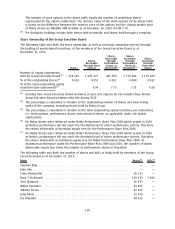
Performance Share Plan 2008 as Nokia’s performance did not reach the threshold level of either
performance criteria. Therefore the shares deliverable at maximum equals zero for the
Performance Share Plan 2008.
(4)
For Performance Share Plans 2009 and 2010 the value of performance shares is presented on the
basis of Nokia’s estimation of the number of shares expected to vest. The intrinsic value for the
Performance Share Plans 2009 and 2010 is based on the closing market price of a Nokia share
on NASDAQ OMX Helsinki as at December 30, 2010 of EUR 7.74. For the Performance Share Plan
2008 no Nokia shares were delivered as Nokia’s performance did not reach the threshold level of
either performance criteria.
(5)
Under the Restricted Share Plans 2007, 2008, 2009 and 2010, awards have been granted
quarterly. For the major part of the awards made under these plans, the restriction period will
end for the 2007 plan, on January 1, 2011; for the 2008 plan, on January 1, 2012; for the 2009
plan, on January 1, 2013; and for the 2010 plan, on January 1, 2014.
(6)
The intrinsic value is based on the closing market price of a Nokia share on NASDAQ OMX Helsinki
as at December 30, 2010 of EUR 7.74.
(7)
Mr. Torres’s termination date under the employment agreement is March 31, 2011. His equity
will forfeit following termination of employment in accordance with the plan rules.
(8)
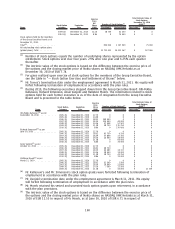
During 2010, the following executives stepped down from the Group Executive Board: OlliPekka
Kallasvuo, Richard Simonson, Hallstein Moerk and Anssi Vanjoki. The information related to
performance shares and restricted shares held by each of the former executives is as of the date
of resignation from the Group Executive Board and is presented in the table below.
Name
Plan
Name
(1)
Number of
Performance
Shares at
Threshold
(13)
Number of
Performance
Shares at
Maximum
(14)
Intrinsic
Value
(EUR)
(12)
Plan
Name
(5)
Number of
Restricted
Shares
Intrinsic
Value
(EUR)
(12)
Performance Shares Restricted Shares
OlliPekka Kallasvuo
(9)
as per
September 20, 2010 ....... 2008 0 0 0 2007 100 000 787 000
2009 117 500 470 000 697 890 2008 75 000 590 250
2010 135 000 540 000 2 124 900 2009 150 000 1 180 500
2010 170 000 1 337 900
Richard Simonson
(9)
as per
June 30, 2010 ........... 2008 0 0 0 2007 35 000 234 850
2009 30 000 120 000 151 921 2008 22 000 147 620
2010 35 000 140 000 469 700 2009 107 000 717 970
2010 111 000 744 810
Anssi Vanjoki
(10)
as per
October 12, 2010 . . ....... 2008 0 0 0 2007 35 000 275 100
2009 30 000 120 000 177 958 2008 22 000 172 920
2010 35 000 140 000 550 200 2009 40 000 314 400
2010 45 000 353 700
Hallstein Moerk
(11)
as per
March 31, 2010 . . . ....... 2008 0 0 0 2007 25 000 288 250
2009 17 500 70 000 152 280 2008 14 000 161 420
2009 25 000 288 250
(9)
Mr. Kallasvuo’s and Mr. Simonson’s performance and restricted share grants were forfeited
following termination of employment in accordance with the plan rules.
(10)
Mr. Vanjoki’s termination date under the employment agreement is March 11, 2011. His equity
will forfeit following termination of employment in accordance with the plan rules.
(11)
Mr. Moerk retained his performance and restricted share grants upon retirement, in accordance
with the equity plan provisions.
(12)
The intrinsic value is based on the closing market price of a Nokia share on NASDAQ OMX Helsinki
as at March 31, 2010 of EUR 11.53 in respect of Mr. Moerk, as at June 30, 2010 of EUR 6.71 in
respect of Mr. Simonson, as at September 20, 2010 of EUR 7.87 in respect of Mr. Kallasvuo and as
at October 12, 2010 of EUR 7.86 in respect of Mr. Vanjoki.
162