Nokia 2010 Annual Report Download - page 221
Download and view the complete annual report
Please find page 221 of the 2010 Nokia annual report below. You can navigate through the pages in the report by either clicking on the pages listed below, or by using the keyword search tool below to find specific information within the annual report.-
 1
1 -
2
-
3
-
4
-
5
-
6
-
7
-
8
-
9
-
10
-
11
-
12
-
13
-
14
-
15
-
16
-
17
-
18
-
19
-
20
-
21
-
22
-
23
-
24
-
25
-
26
-
27
-
28
-
29
-
30
-
31
-
32
-
33
-
34
-
35
-
36
-
37
-
38
-
39
-
40
-
41
-
42
-
43
-
44
-
45
-
46
-
47
-
48
-
49
-
50
-
51
-
52
-
53
-
54
-
55
-
56
-
57
-
58
-
59
-
60
-
61
-
62
-
63
-
64
-
65
-
66
-
67
-
68
-
69
-
70
-
71
-
72
-
73
-
74
-
75
-
76
-
77
-
78
-
79
-
80
-
81
-
82
-
83
-
84
-
85
-
86
-
87
-
88
-
89
-
90
-
91
-
92
-
93
-
94
-
95
-
96
-
97
-
98
-
99
-
100
-
101
-
102
-
103
-
104
-
105
-
106
-
107
-
108
-
109
-
110
-
111
-
112
-
113
-
114
-
115
-
116
-
117
-
118
-
119
-
120
-
121
-
122
-
123
-
124
-
125
-
126
-
127
-
128
-
129
-
130
-
131
-
132
-
133
-
134
-
135
-
136
-
137
-
138
-
139
-
140
-
141
-
142
-
143
-
144
-
145
-
146
-
147
-
148
-
149
-
150
-
151
-
152
-
153
-
154
-
155
-
156
-
157
-
158
-
159
-
160
-
161
-
162
-
163
-
164
-
165
-
166
-
167
-
168
-
169
-
170
-
171
-
172
-
173
-
174
-
175
-
176
-
177
-
178
-
179
-
180
-
181
-
182
-
183
-
184
-
185
-
186
-
187
-
188
-
189
-
190
-
191
-
192
-
193
-
194
-
195
-
196
-
197
-
198
-
199
-
200
-
201
-
202
-
203
-
204
-
205
-
206
-
207
-
208
-
209
-
210
-
 211
211 -
 212
212 -
 213
213 -
 214
214 -
 215
215 -
 216
216 -
 217
217 -
 218
218 -
 219
219 -
 220
220 -
 221
221 -
 222
222 -
 223
223 -
 224
224 -
 225
225 -
 226
226 -
 227
227 -
 228
228 -
 229
229 -
 230
230 -
 231
231 -
232
-
233
-
234
-
235
-
236
-
237
-
238
-
239
-
240
-
241
-
242
-
243
-
244
-
245
-
246
-
247
-
248
-
249
-
250
-
251
-
252
-
253
-
254
-
255
-
256
-
257
-
258
-
259
-
260
-
261
-
262
-
263
-
264
-
265
-
266
-
267
-
268
-
269
-
270
-
271
-
272
-
273
-
274
-
275
 |
 |

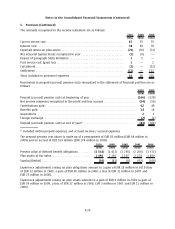
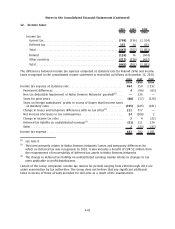
8. Impairment
2010 2009 2008
EURm EURm EURm
Goodwill ........................................................ —908 —
Other intangible assets ............................................. —56 —
Property, plant and equipment ...................................... —177
Inventories ...................................................... ——13
Investments in associated companies ................................. —19 8
Availableforsale investments ....................................... 107 25 43
Other noncurrent assets ........................................... 3—8
Total ........................................................... 110 1 009 149
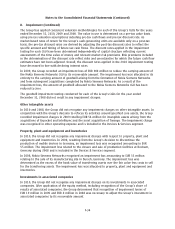
Goodwill
Goodwill is allocated to the Group’s cashgenerating units (CGU) for the purpose of impairment
testing. The allocation is made to those cashgenerating units that are expected to benefit from the
synergies of the business combination in which the goodwill arose. In 2010, the Group has goodwill
allocated to two cashgenerating units, which correspond to the Group’s reportable segments:
Devices & Services CGU and NAVTEQ CGU.
The recoverable amounts for the Devices & Services CGU and the NAVTEQ CGU are based on value in
use calculations. The cash flow projections employed in the value in use calculation are based on
financial plans approved by management. These projections are consistent with external sources of
information, wherever available. Cash flows beyond the explicit forecast period are extrapolated using
an estimated terminal growth rate that does not exceed the longterm average growth rates for the
industry and economies in which the CGU operates. The impairment testing has been carried out
based on management’s assessment of financial performance and future strategies in light of current
and expected market and economic conditions. Events that occurred subsequent to the balance sheet
date, as discussed in Note 33, did not have an impact on this assessment.
Goodwill amounting to EUR 1 355 million has been allocated to the Devices & Services CGU for the
purpose of impairment testing. The goodwill impairment testing conducted for the Devices & Services
CGU for the year ended December 31, 2010 did not result in any impairment charges.
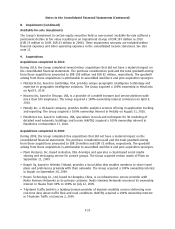
Goodwill amounting to EUR 4 368 million has been allocated to the NAVTEQ CGU. The goodwill
impairment testing conducted for the NAVTEQ CGU for the year ended December 31, 2010 did not
result in any impairment charges. The recoverable amount of the NAVTEQ CGU is between 1520%
higher than its carrying amount. The Group has concluded that a reasonably possible change of
between 12% in the valuation assumptions for longterm growth rate and discount rate would give
rise to an impairment loss.
The key assumptions applied in the impairment testing analysis for each CGU are presented in the
table below:
Devices &
Services NAVTEQ
Cashgenerating unit
%%
Terminal growth rate............................................... 2.0 4.0
Posttax discount rate .............................................. 8.7 9.6
Pretax discount rate ............................................... 11.1 12.8
F33
Notes to the Consolidated Financial Statements (Continued)