Nokia 2010 Annual Report Download - page 106
Download and view the complete annual report
Please find page 106 of the 2010 Nokia annual report below. You can navigate through the pages in the report by either clicking on the pages listed below, or by using the keyword search tool below to find specific information within the annual report.-
 1
1 -
2
-
3
-
4
-
5
-
6
-
7
-
8
-
9
-
10
-
11
-
12
-
13
-
14
-
15
-
16
-
17
-
18
-
19
-
20
-
21
-
22
-
23
-
24
-
25
-
26
-
27
-
28
-
29
-
30
-
31
-
32
-
33
-
34
-
35
-
36
-
37
-
38
-
39
-
40
-
41
-
42
-
43
-
44
-
45
-
46
-
47
-
48
-
49
-
50
-
51
-
52
-
53
-
54
-
55
-
56
-
57
-
58
-
59
-
60
-
61
-
62
-
63
-
64
-
65
-
66
-
67
-
68
-
69
-
70
-
71
-
72
-
73
-
74
-
75
-
76
-
77
-
78
-
79
-
80
-
81
-
82
-
83
-
84
-
85
-
86
-
87
-
88
-
89
-
90
-
91
-
92
-
93
-
94
-
95
-
 96
96 -
 97
97 -
 98
98 -
 99
99 -
 100
100 -
 101
101 -
 102
102 -
 103
103 -
 104
104 -
 105
105 -
 106
106 -
 107
107 -
 108
108 -
 109
109 -
 110
110 -
 111
111 -
 112
112 -
 113
113 -
 114
114 -
 115
115 -
 116
116 -
117
-
118
-
119
-
120
-
121
-
122
-
123
-
124
-
125
-
126
-
127
-
128
-
129
-
130
-
131
-
132
-
133
-
134
-
135
-
136
-
137
-
138
-
139
-
140
-
141
-
142
-
143
-
144
-
145
-
146
-
147
-
148
-
149
-
150
-
151
-
152
-
153
-
154
-
155
-
156
-
157
-
158
-
159
-
160
-
161
-
162
-
163
-
164
-
165
-
166
-
167
-
168
-
169
-
170
-
171
-
172
-
173
-
174
-
175
-
176
-
177
-
178
-
179
-
180
-
181
-
182
-
183
-
184
-
185
-
186
-
187
-
188
-
189
-
190
-
191
-
192
-
193
-
194
-
195
-
196
-
197
-
198
-
199
-
200
-
201
-
202
-
203
-
204
-
205
-
206
-
207
-
208
-
209
-
210
-
211
-
212
-
213
-
214
-
215
-
216
-
217
-
218
-
219
-
220
-
221
-
222
-
223
-
224
-
225
-
226
-
227
-
228
-
229
-
230
-
231
-
232
-
233
-
234
-
235
-
236
-
237
-
238
-
239
-
240
-
241
-
242
-
243
-
244
-
245
-
246
-
247
-
248
-
249
-
250
-
251
-
252
-
253
-
254
-
255
-
256
-
257
-
258
-
259
-
260
-
261
-
262
-
263
-
264
-
265
-
266
-
267
-
268
-
269
-
270
-
271
-
272
-
273
-
274
-
275
 |
 |

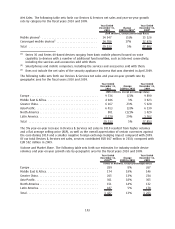
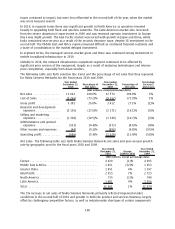
Latin America. Our device market share decreased in AsiaPacific, Middle East & Africa, Europe and
North America. Our device market share was flat in Greater China.
In Latin America, our market share increased. Our share increased in, for example, Chile, Colombia,
Paraguay and Peru, but was partly offset by market share declines in Argentina, Brazil, Mexico and
some other countries.
In AsiaPacific, our market share declined in 2010 as a result of market share losses in several
markets, including India, Indonesia, Singapore, Vietnam and some other countries, but this was partly
offset by market share increases in, for example, Australia, Thailand and Philippines. In Middle East &
Africa, our market share decline was driven by share losses in markets such as Egypt, Nigeria and UAE,
which was offset to some extent by share gains in some markets such as South Africa and Pakistan.
In Europe, our market share declined in markets including the UK and Spain, but was partly offset by
share gains in markets such as Italy and France. Our market share declined in North America in 2010
primarily due to a market share decline in the United States offset to some extent by our market
share increase in Canada. In Greater China, we continued to benefit from our brand, broad product
portfolio and extensive distribution system during 2010.
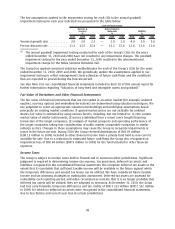
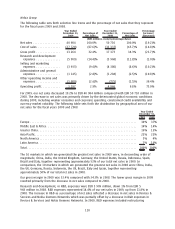
Average Selling Price.
The following table sets forth our mobile device ASP and yearonyear growth
rate by category for the fiscal years 2010 and 2009.
Year Ended
December 31,
2010
Change
2009 to 2010
Year Ended
December 31,
2009
(EUR millions, except percentage data)
Mobile phones
1
................................... 41 (2)% 42
Converged mobile devices
2
.......................... 147 (21)% 187
Total ............................................ 64 0% 64
(1)
Series 30 and Series 40based devices ranging from basic mobile phones focused on voice
capability to devices with a number of additional functionalities, such as Internet connectivity,
including the services and accessories sold with them.
(2)
Smartphones and mobile computers, including the services and accessories sold with them.
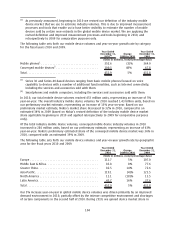
Our mobile device ASP (including services revenue) in 2010 was EUR 64, unchanged from 2009. During
the first half of 2010, our device ASP decreased primarily as a result of general price erosion across
our mobile device portfolio and a higher proportion of lowerpriced converged mobile device sales,
offset to some extent by the positive impact of converged mobile devices representing a higher
proportion of our overall mobile device sales compared to 2009. However, the decrease in our ASP
during the first half of 2010 was offset by an increase in our ASP during the second half of 2010. The
increase in our ASP during the second half of 2010 was due primarily to converged mobile devices
representing a higher proportion of our overall mobile device sales and the appreciation of certain
currencies against the euro. This increase was offset to some extent by general price erosion driven
by the intense competitive environment and a higher proportion of lowerpriced converged mobile
device sales, which is reflected in the 21% decline in our converged mobile devices ASP in 2010
compared to 2009.
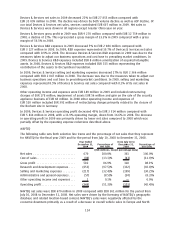
Profitability.
Devices & Services gross profit decreased 5% to EUR 8.8 billion, compared with
EUR 9.3 billion in 2009, with a gross margin of 30.1% (33.3% in 2009). The gross margin decline was
primarily due to general price pressure and product material cost erosion being less than general
product price erosion, offset to some extent by converged mobile device volumes representing a
higher proportion of overall mobile device volumes. Additionally, the gross margin was negatively
impacted in 2010 by the overall appreciation of certain currencies against the euro and unfavorable
foreign exchange hedging compared with 2009. During the first half of 2010, the gross margin was
positively impacted by the depreciation of certain currencies against the euro. However, this positive
105