Nokia 2010 Annual Report Download - page 108
Download and view the complete annual report
Please find page 108 of the 2010 Nokia annual report below. You can navigate through the pages in the report by either clicking on the pages listed below, or by using the keyword search tool below to find specific information within the annual report.-
 1
1 -
2
-
3
-
4
-
5
-
6
-
7
-
8
-
9
-
10
-
11
-
12
-
13
-
14
-
15
-
16
-
17
-
18
-
19
-
20
-
21
-
22
-
23
-
24
-
25
-
26
-
27
-
28
-
29
-
30
-
31
-
32
-
33
-
34
-
35
-
36
-
37
-
38
-
39
-
40
-
41
-
42
-
43
-
44
-
45
-
46
-
47
-
48
-
49
-
50
-
51
-
52
-
53
-
54
-
55
-
56
-
57
-
58
-
59
-
60
-
61
-
62
-
63
-
64
-
65
-
66
-
67
-
68
-
69
-
70
-
71
-
72
-
73
-
74
-
75
-
76
-
77
-
78
-
79
-
80
-
81
-
82
-
83
-
84
-
85
-
86
-
87
-
88
-
89
-
90
-
91
-
92
-
93
-
94
-
95
-
96
-
97
-
 98
98 -
 99
99 -
 100
100 -
 101
101 -
 102
102 -
 103
103 -
 104
104 -
 105
105 -
 106
106 -
 107
107 -
 108
108 -
 109
109 -
 110
110 -
 111
111 -
 112
112 -
 113
113 -
 114
114 -
 115
115 -
 116
116 -
 117
117 -
 118
118 -
119
-
120
-
121
-
122
-
123
-
124
-
125
-
126
-
127
-
128
-
129
-
130
-
131
-
132
-
133
-
134
-
135
-
136
-
137
-
138
-
139
-
140
-
141
-
142
-
143
-
144
-
145
-
146
-
147
-
148
-
149
-
150
-
151
-
152
-
153
-
154
-
155
-
156
-
157
-
158
-
159
-
160
-
161
-
162
-
163
-
164
-
165
-
166
-
167
-
168
-
169
-
170
-
171
-
172
-
173
-
174
-
175
-
176
-
177
-
178
-
179
-
180
-
181
-
182
-
183
-
184
-
185
-
186
-
187
-
188
-
189
-
190
-
191
-
192
-
193
-
194
-
195
-
196
-
197
-
198
-
199
-
200
-
201
-
202
-
203
-
204
-
205
-
206
-
207
-
208
-
209
-
210
-
211
-
212
-
213
-
214
-
215
-
216
-
217
-
218
-
219
-
220
-
221
-
222
-
223
-
224
-
225
-
226
-
227
-
228
-
229
-
230
-
231
-
232
-
233
-
234
-
235
-
236
-
237
-
238
-
239
-
240
-
241
-
242
-
243
-
244
-
245
-
246
-
247
-
248
-
249
-
250
-
251
-
252
-
253
-
254
-
255
-
256
-
257
-
258
-
259
-
260
-
261
-
262
-
263
-
264
-
265
-
266
-
267
-
268
-
269
-
270
-
271
-
272
-
273
-
274
-
275
 |
 |

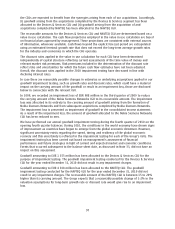
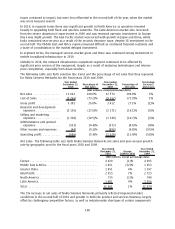
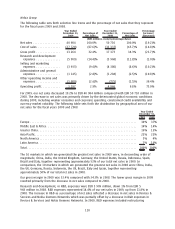
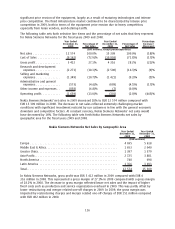
Net Sales.
The following table sets forth NAVTEQ net sales and yearonyear growth rate by
geographic area for the fiscal years 2010 and 2009.
Year Ended
December 31,
2010
Change
2009 to 2010
Year Ended
December 31,
2009
(EUR millions, except percentage data)
Europe .......................................... 429 38% 312
Middle East & Africa ................................ 60 107% 29
Greater China ..................................... 92 5
AsiaPacific. . ..................................... 73 306% 18
North America .................................... 325 11% 293
Latin America..................................... 23 77% 13
Total ............................................ 1002 50% 670
Net sales of NAVTEQ were EUR 1.0 billion in 2010, compared to EUR 670 million in 2009. Europe
accounted for 43% (46%) of NAVTEQ’s net sales, North America 33% (44%), Middle East & Africa 6%
(4%), AsiaPacific 7% (3%), Latin America 2% (2%) and Greater China 9% (1%) in 2010 (2009). The
yearonyear increase in net sales was primarily driven by growth in mobile device sales, particularly
Nokia mobile devices, improved sales of map licenses to mobile device customers, as well as
improved conditions and higher navigation uptake rates in the automotive industry.
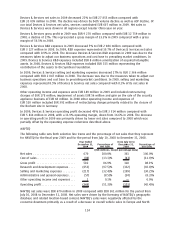
Profitability.
NAVTEQ gross profit was EUR 849 million in 2010, compared to EUR 582 million in 2009,
with a gross margin of 84.7% (86.9% in 2009). The lower gross margin in 2010 was primarily due to
changes in net sales mix.
NAVTEQ R&D expenses in 2010 were EUR 751 million, compared with EUR 653 million in 2009. NAVTEQ
R&D expenses included amortization of intangible assets recorded as part of Nokia’s acquisition of
NAVTEQ totaling EUR 366 million and EUR 346 million in 2010 and 2009, respectively. R&D expenses in
2010 were also driven by increased investment in NAVTEQ’s map database related to geographic
expansion and quality improvements in 2010. R&D expenses represented 75.0% of NAVTEQ net sales
in 2010, compared to 97.5% of NAVTEQ net sales in 2009.
NAVTEQ selling and marketing expenses in 2010 were EUR 250 million, compared with
EUR 217 million in 2009. NAVTEQ selling and marketing expenses primarily consisted of amortization
of intangible assets recorded as part of Nokia’s acquisition of NAVTEQ totaling EUR 121 million and
EUR 115 million in 2010 and 2009, respectively. Selling and marketing expenses in 2010 were also
driven by investments to grow NAVTEQ’s worldwide sales force and expand the breadth of its product
offerings. Selling and marketing expenses represented 25.0% of NAVTEQ net sales in 2010, compared
to 32.4% of NAVTEQ net sales in 2009.
NAVTEQ operating loss was EUR 225 million in 2010, compared to a loss of EUR 344 million in 2009.
NAVTEQ operating margin was 22.5% (51.3% in 2009). The yearonyear improvement in operating
margin was primarily due to higher net sales offset to some extent by the lower gross margin and
higher operating expenses.
Nokia Siemens Networks
According to our estimates, the mobile infrastructure market remained flat in euro terms in 2010
compared to 2009 with the trend varying, depending on region. In the first half of 2010 there was
some easing of the difficult market conditions experienced in 2009—when the deterioration in global
economic conditions caused many operators to delay investments in network infrastructure—but this
improvement was offset by two industry specific factors that caused the overall market to continue to
decline. First, a global component shortage restricted deliveries of certain products. Second, the
introduction of new security clearance processes for telecommunications in India, prevented the
completion of product sales to customers during the second and third quarters of the year. These
107