Nokia 2010 Annual Report Download - page 190
Download and view the complete annual report
Please find page 190 of the 2010 Nokia annual report below. You can navigate through the pages in the report by either clicking on the pages listed below, or by using the keyword search tool below to find specific information within the annual report.-
 1
1 -
2
-
3
-
4
-
5
-
6
-
7
-
8
-
9
-
10
-
11
-
12
-
13
-
14
-
15
-
16
-
17
-
18
-
19
-
20
-
21
-
22
-
23
-
24
-
25
-
26
-
27
-
28
-
29
-
30
-
31
-
32
-
33
-
34
-
35
-
36
-
37
-
38
-
39
-
40
-
41
-
42
-
43
-
44
-
45
-
46
-
47
-
48
-
49
-
50
-
51
-
52
-
53
-
54
-
55
-
56
-
57
-
58
-
59
-
60
-
61
-
62
-
63
-
64
-
65
-
66
-
67
-
68
-
69
-
70
-
71
-
72
-
73
-
74
-
75
-
76
-
77
-
78
-
79
-
80
-
81
-
82
-
83
-
84
-
85
-
86
-
87
-
88
-
89
-
90
-
91
-
92
-
93
-
94
-
95
-
96
-
97
-
98
-
99
-
100
-
101
-
102
-
103
-
104
-
105
-
106
-
107
-
108
-
109
-
110
-
111
-
112
-
113
-
114
-
115
-
116
-
117
-
118
-
119
-
120
-
121
-
122
-
123
-
124
-
125
-
126
-
127
-
128
-
129
-
130
-
131
-
132
-
133
-
134
-
135
-
136
-
137
-
138
-
139
-
140
-
141
-
142
-
143
-
144
-
145
-
146
-
147
-
148
-
149
-
150
-
151
-
152
-
153
-
154
-
155
-
156
-
157
-
158
-
159
-
160
-
161
-
162
-
163
-
164
-
165
-
166
-
167
-
168
-
169
-
170
-
171
-
172
-
173
-
174
-
175
-
176
-
177
-
178
-
179
-
 180
180 -
 181
181 -
 182
182 -
 183
183 -
 184
184 -
 185
185 -
 186
186 -
 187
187 -
 188
188 -
 189
189 -
 190
190 -
 191
191 -
 192
192 -
 193
193 -
 194
194 -
 195
195 -
 196
196 -
 197
197 -
 198
198 -
 199
199 -
 200
200 -
201
-
202
-
203
-
204
-
205
-
206
-
207
-
208
-
209
-
210
-
211
-
212
-
213
-
214
-
215
-
216
-
217
-
218
-
219
-
220
-
221
-
222
-
223
-
224
-
225
-
226
-
227
-
228
-
229
-
230
-
231
-
232
-
233
-
234
-
235
-
236
-
237
-
238
-
239
-
240
-
241
-
242
-
243
-
244
-
245
-
246
-
247
-
248
-
249
-
250
-
251
-
252
-
253
-
254
-
255
-
256
-
257
-
258
-
259
-
260
-
261
-
262
-
263
-
264
-
265
-
266
-
267
-
268
-
269
-
270
-
271
-
272
-
273
-
274
-
275
 |
 |

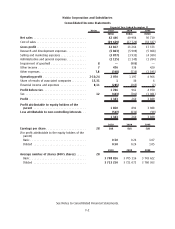
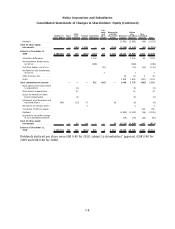
Nokia Corporation and Subsidiaries
Consolidated Income Statements
Notes 2010 2009 2008
Financial Year Ended December 31
EURm EURm EURm
Net sales ................................. 42 446 40 984 50 710
Cost of sales ............................... (29 629) (27 720) (33 337)
Gross profit ............................... 12 817 13 264 17 373
Research and development expenses ............ (5 863) (5 909) (5 968)
Selling and marketing expenses . . . . ............ (3 877) (3 933) (4 380)
Administrative and general expenses ............ (1 115) (1 145) (1 284)
Impairment of goodwill . . . ................... 8—(908) —
Other income . . . ........................... 7 476 338 420
Other expenses . . ........................... 7,8 (368) (510) (1 195)
Operating profit ........................... 210,24 2 070 1 197 4 966
Share of results of associated companies . ........ 15,31 1 30 6
Financial income and expenses . . . . ............ 8,11 (285) (265) (2)
Profit before tax ........................... 1 786 962 4 970
Tax ...................................... 12 (443) (702) (1 081)
Profit .................................... 1 343 260 3 889
Profit attributable to equity holders of the
parent ................................. 1 850 891 3 988
Loss attributable to noncontrolling interests... (507) (631) (99)
1 343 260 3 889
2010 2009 2008
Earnings per share ......................... 28
EUR EUR EUR
(for profit attributable to the equity holders of the
parent)
Basic ................................... 0.50 0.24 1.07
Diluted . . ............................... 0.50 0.24 1.05
2010 2009 2008
Average number of shares (000’s shares) ...... 28
Basic ................................... 3 708 816 3 705 116 3 743 622
Diluted . . ............................... 3 713 250 3 721 072 3 780 363
See Notes to Consolidated Financial Statements.
F2