Nokia 2010 Annual Report Download - page 113
Download and view the complete annual report
Please find page 113 of the 2010 Nokia annual report below. You can navigate through the pages in the report by either clicking on the pages listed below, or by using the keyword search tool below to find specific information within the annual report.-
 1
1 -
2
-
3
-
4
-
5
-
6
-
7
-
8
-
9
-
10
-
11
-
12
-
13
-
14
-
15
-
16
-
17
-
18
-
19
-
20
-
21
-
22
-
23
-
24
-
25
-
26
-
27
-
28
-
29
-
30
-
31
-
32
-
33
-
34
-
35
-
36
-
37
-
38
-
39
-
40
-
41
-
42
-
43
-
44
-
45
-
46
-
47
-
48
-
49
-
50
-
51
-
52
-
53
-
54
-
55
-
56
-
57
-
58
-
59
-
60
-
61
-
62
-
63
-
64
-
65
-
66
-
67
-
68
-
69
-
70
-
71
-
72
-
73
-
74
-
75
-
76
-
77
-
78
-
79
-
80
-
81
-
82
-
83
-
84
-
85
-
86
-
87
-
88
-
89
-
90
-
91
-
92
-
93
-
94
-
95
-
96
-
97
-
98
-
99
-
100
-
101
-
102
-
 103
103 -
 104
104 -
 105
105 -
 106
106 -
 107
107 -
 108
108 -
 109
109 -
 110
110 -
 111
111 -
 112
112 -
 113
113 -
 114
114 -
 115
115 -
 116
116 -
 117
117 -
 118
118 -
 119
119 -
 120
120 -
 121
121 -
 122
122 -
 123
123 -
124
-
125
-
126
-
127
-
128
-
129
-
130
-
131
-
132
-
133
-
134
-
135
-
136
-
137
-
138
-
139
-
140
-
141
-
142
-
143
-
144
-
145
-
146
-
147
-
148
-
149
-
150
-
151
-
152
-
153
-
154
-
155
-
156
-
157
-
158
-
159
-
160
-
161
-
162
-
163
-
164
-
165
-
166
-
167
-
168
-
169
-
170
-
171
-
172
-
173
-
174
-
175
-
176
-
177
-
178
-
179
-
180
-
181
-
182
-
183
-
184
-
185
-
186
-
187
-
188
-
189
-
190
-
191
-
192
-
193
-
194
-
195
-
196
-
197
-
198
-
199
-
200
-
201
-
202
-
203
-
204
-
205
-
206
-
207
-
208
-
209
-
210
-
211
-
212
-
213
-
214
-
215
-
216
-
217
-
218
-
219
-
220
-
221
-
222
-
223
-
224
-
225
-
226
-
227
-
228
-
229
-
230
-
231
-
232
-
233
-
234
-
235
-
236
-
237
-
238
-
239
-
240
-
241
-
242
-
243
-
244
-
245
-
246
-
247
-
248
-
249
-
250
-
251
-
252
-
253
-
254
-
255
-
256
-
257
-
258
-
259
-
260
-
261
-
262
-
263
-
264
-
265
-
266
-
267
-
268
-
269
-
270
-
271
-
272
-
273
-
274
-
275
 |
 |

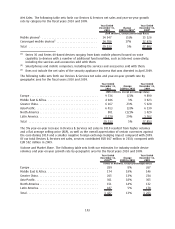
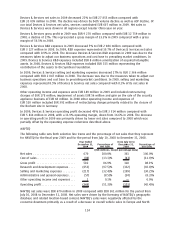
certain locations in Asia and other emerging markets. For comparative purposes only, applying the
revised definition and improved measurement processes and tools that we were using since the
beginning of 2010 retrospectively to 2009, we estimate that industry mobile device volumes in
2009 would have been 1.26 billion units. We are not able to apply our revised definition and
improved measurement processes and tools retrospectively to our estimated industry mobile
device volumes in 2008 due to lack of visibility and data. The industry mobile device volumes
estimated for 2008 are not comparable with the industry mobile device volumes estimates based
on the revised definition.
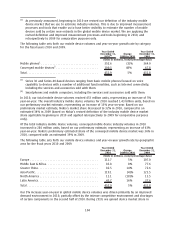
According to our estimates, in 2009 industry mobile device volumes, based on the 2009 definition,
decreased by 6% to 1.14 billion units, compared with an estimated 1.21 billion units in 2008. The
global device market was negatively impacted in 2009 by the difficult global economic conditions,
including weaker consumer and corporate spending, constrained credit availability and currency
market volatility. The demand environment for mobile devices improved during the latter part of the
year as the global economy started to show initial signs of recovery.
We estimate that emerging markets accounted for approximately 63% of industry mobile device
volumes in 2009, based on the 2009 definition, unchanged from 2008. The devaluation of emerging
market currencies impacted the purchasing power of consumers in emerging markets, where Nokia’s
market share is strong. The entrylevel device market (devices priced at 50 euro or under) continued
to be one of the fastest growing segments for the market. This was particularly the case in 2009
where we estimate this part of the market represented approximately 48% of total industry volumes
compared to 44% in 2008. We estimate the converged mobile device market was approximately
176 million units globally in 2009, growing from approximately 161 million units in 2008, despite of
the decline in total industry mobile device volumes based on the 2009 definition.
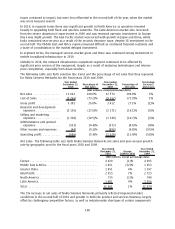
At the end of 2009, we estimate that there were approximately 4.6 billion mobile subscriptions
globally, representing approximately 67% global penetration. This is compared to approximately
3.9 billion mobile subscribers at the end of 2008 and approximately 58% global penetration.
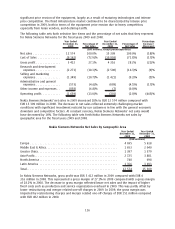
The following table sets forth our mobile device volumes and yearonyear growth rate by geographic
area for the fiscal years 2009 and 2008. The estimates of Nokia’s volume market share in the
following discussion are based on our definition of the industry mobile device market used in 2009
and 2008.
Year Ended
December 31,
2009
(*)
Change
2008 to 2009
Year Ended
December 31,
2008
(Units in millions, except percentage data)
Europe .......................................... 107.0 (6.9)% 114.9
Middle East & Africa ................................ 77.7 (4.1)% 81.0
Greater China ..................................... 72.6 1.8% 71.3
AsiaPacific. . ..................................... 123.5 (7.8)% 134.0
North America .................................... 13.5 (14.0)% 15.7
Latin America..................................... 37.5 (27.2)% 51.5
Total ............................................ 431.8 (7.8)% 468.4
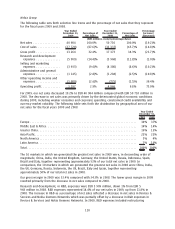
* For comparative purposes only, applying the revised definition of the industry mobile device market
(see note 1 to the industry mobile device volume table above) retrospectively to 2009, Nokia
estimates that its mobile device volume market share would have been 34% in 2009 on an annual
basis. Nokia is not able to apply the revised definition and improved measurement processes and
tools retrospectively to Nokia’s estimated volume market share in 2008 due to lack of visibility and
data. Nokia’s volume market share estimated for 2008 is not comparable with Nokia’s volume
market share estimates based on the revised definition.
112