Nokia 2010 Annual Report Download - page 107
Download and view the complete annual report
Please find page 107 of the 2010 Nokia annual report below. You can navigate through the pages in the report by either clicking on the pages listed below, or by using the keyword search tool below to find specific information within the annual report.-
 1
1 -
2
-
3
-
4
-
5
-
6
-
7
-
8
-
9
-
10
-
11
-
12
-
13
-
14
-
15
-
16
-
17
-
18
-
19
-
20
-
21
-
22
-
23
-
24
-
25
-
26
-
27
-
28
-
29
-
30
-
31
-
32
-
33
-
34
-
35
-
36
-
37
-
38
-
39
-
40
-
41
-
42
-
43
-
44
-
45
-
46
-
47
-
48
-
49
-
50
-
51
-
52
-
53
-
54
-
55
-
56
-
57
-
58
-
59
-
60
-
61
-
62
-
63
-
64
-
65
-
66
-
67
-
68
-
69
-
70
-
71
-
72
-
73
-
74
-
75
-
76
-
77
-
78
-
79
-
80
-
81
-
82
-
83
-
84
-
85
-
86
-
87
-
88
-
89
-
90
-
91
-
92
-
93
-
94
-
95
-
96
-
 97
97 -
 98
98 -
 99
99 -
 100
100 -
 101
101 -
 102
102 -
 103
103 -
 104
104 -
 105
105 -
 106
106 -
 107
107 -
 108
108 -
 109
109 -
 110
110 -
 111
111 -
 112
112 -
 113
113 -
 114
114 -
 115
115 -
 116
116 -
 117
117 -
118
-
119
-
120
-
121
-
122
-
123
-
124
-
125
-
126
-
127
-
128
-
129
-
130
-
131
-
132
-
133
-
134
-
135
-
136
-
137
-
138
-
139
-
140
-
141
-
142
-
143
-
144
-
145
-
146
-
147
-
148
-
149
-
150
-
151
-
152
-
153
-
154
-
155
-
156
-
157
-
158
-
159
-
160
-
161
-
162
-
163
-
164
-
165
-
166
-
167
-
168
-
169
-
170
-
171
-
172
-
173
-
174
-
175
-
176
-
177
-
178
-
179
-
180
-
181
-
182
-
183
-
184
-
185
-
186
-
187
-
188
-
189
-
190
-
191
-
192
-
193
-
194
-
195
-
196
-
197
-
198
-
199
-
200
-
201
-
202
-
203
-
204
-
205
-
206
-
207
-
208
-
209
-
210
-
211
-
212
-
213
-
214
-
215
-
216
-
217
-
218
-
219
-
220
-
221
-
222
-
223
-
224
-
225
-
226
-
227
-
228
-
229
-
230
-
231
-
232
-
233
-
234
-
235
-
236
-
237
-
238
-
239
-
240
-
241
-
242
-
243
-
244
-
245
-
246
-
247
-
248
-
249
-
250
-
251
-
252
-
253
-
254
-
255
-
256
-
257
-
258
-
259
-
260
-
261
-
262
-
263
-
264
-
265
-
266
-
267
-
268
-
269
-
270
-
271
-
272
-
273
-
274
-
275
 |
 |

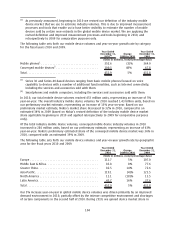
impact was more than offset by the appreciation of certain currencies against the euro during the
second half of 2010. Further, during the first half of 2010, the gross margin was negatively impacted
by unfavorable foreign exchange hedging, which was to some extent offset by a favorable foreign
exchange hedging impact during the second half of 2010.
Devices & Services R&D expenses in 2010 decreased 1% to EUR 2 954 million, compared with
EUR 2 984 million in 2009. In 2010, R&D expenses represented 10.1% of Devices & Services net sales,
compared with 10.7% in 2009. The decrease in Devices & Services R&D expenses in 2010 was
primarily due to the measures taken to adjust our business operations and cost base to prevailing
market conditions. Devices & Services R&D expenses included amortization of acquired intangible
assets of EUR 10 million and EUR 8 million in 2010 and 2009, respectively.
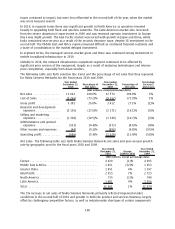
In 2010, Devices & Services selling and marketing expenses decreased 3% to EUR 2 294 million,
compared with EUR 2 366 million in 2009. The decrease was primarily due to the measures taken to
adjust our business operations and cost base to prevailing market conditions. In 2010, selling and
marketing expenses represented 7.9% of Devices & Services net sales, compared with 8.5% of its net
sales in 2009.
Other operating income and expenses were EUR 170 million in 2010 and included restructuring
charges of EUR 85 million, a prior yearrelated refund of customs duties of EUR 61 million, a gain on
sale of assets and business of EUR 29 million and a gain on sale of the wireless modem business of
EUR 147 million. In 2009, other operating income and expenses were EUR 189 million and included
restructuring charges of EUR 178 million, impairment of assets of EUR 56 million and gain on the sale
of the security appliance business of EUR 68 million.
Devices & Services operating profit remained virtually unchanged at EUR 3.3 billion, compared with
2009. Devices & Services operating margin in 2010 was 11.3%, compared with 11.9% in 2009. The
yearonyear decrease in operating margin in 2010 was driven primarily by the lower gross margin
compared to 2009.
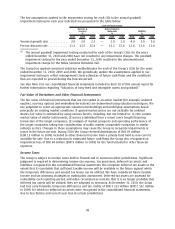
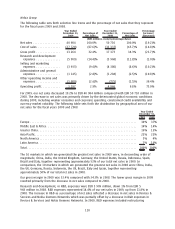
NAVTEQ
The following table sets forth selective line items and the percentage of net sales that they represent
for NAVTEQ for the fiscal years 2010 and 2009.
Year Ended
December 31,
2010
Percentage of
Net Sales
Year Ended
December 31,
2009
Percentage of
Net Sales
(EUR millions, except percentage data)
Net sales............................ 1002 100.0% 670 100.0%
Cost of sales ......................... (153) (15.3)% (88) (13.1)%
Gross profit.......................... 849 84.7% 582 86.9%
Research and development expenses ..... (751) (75.0)% (653) (97.5)%
Selling and marketing expenses ......... (250) (25.0)% (217) (32.4)%
Administrative and general expenses ..... (70) (7.0)% (57) (8.5)%
Other operating income and expenses .... (3) (0.3)% 1
Operating profit ...................... (225) (22.5)% (344) (51.3)%
106