Nokia 2010 Annual Report Download - page 114
Download and view the complete annual report
Please find page 114 of the 2010 Nokia annual report below. You can navigate through the pages in the report by either clicking on the pages listed below, or by using the keyword search tool below to find specific information within the annual report.-
 1
1 -
2
-
3
-
4
-
5
-
6
-
7
-
8
-
9
-
10
-
11
-
12
-
13
-
14
-
15
-
16
-
17
-
18
-
19
-
20
-
21
-
22
-
23
-
24
-
25
-
26
-
27
-
28
-
29
-
30
-
31
-
32
-
33
-
34
-
35
-
36
-
37
-
38
-
39
-
40
-
41
-
42
-
43
-
44
-
45
-
46
-
47
-
48
-
49
-
50
-
51
-
52
-
53
-
54
-
55
-
56
-
57
-
58
-
59
-
60
-
61
-
62
-
63
-
64
-
65
-
66
-
67
-
68
-
69
-
70
-
71
-
72
-
73
-
74
-
75
-
76
-
77
-
78
-
79
-
80
-
81
-
82
-
83
-
84
-
85
-
86
-
87
-
88
-
89
-
90
-
91
-
92
-
93
-
94
-
95
-
96
-
97
-
98
-
99
-
100
-
101
-
102
-
103
-
 104
104 -
 105
105 -
 106
106 -
 107
107 -
 108
108 -
 109
109 -
 110
110 -
 111
111 -
 112
112 -
 113
113 -
 114
114 -
 115
115 -
 116
116 -
 117
117 -
 118
118 -
 119
119 -
 120
120 -
 121
121 -
 122
122 -
 123
123 -
 124
124 -
125
-
126
-
127
-
128
-
129
-
130
-
131
-
132
-
133
-
134
-
135
-
136
-
137
-
138
-
139
-
140
-
141
-
142
-
143
-
144
-
145
-
146
-
147
-
148
-
149
-
150
-
151
-
152
-
153
-
154
-
155
-
156
-
157
-
158
-
159
-
160
-
161
-
162
-
163
-
164
-
165
-
166
-
167
-
168
-
169
-
170
-
171
-
172
-
173
-
174
-
175
-
176
-
177
-
178
-
179
-
180
-
181
-
182
-
183
-
184
-
185
-
186
-
187
-
188
-
189
-
190
-
191
-
192
-
193
-
194
-
195
-
196
-
197
-
198
-
199
-
200
-
201
-
202
-
203
-
204
-
205
-
206
-
207
-
208
-
209
-
210
-
211
-
212
-
213
-
214
-
215
-
216
-
217
-
218
-
219
-
220
-
221
-
222
-
223
-
224
-
225
-
226
-
227
-
228
-
229
-
230
-
231
-
232
-
233
-
234
-
235
-
236
-
237
-
238
-
239
-
240
-
241
-
242
-
243
-
244
-
245
-
246
-
247
-
248
-
249
-
250
-
251
-
252
-
253
-
254
-
255
-
256
-
257
-
258
-
259
-
260
-
261
-
262
-
263
-
264
-
265
-
266
-
267
-
268
-
269
-
270
-
271
-
272
-
273
-
274
-
275
 |
 |

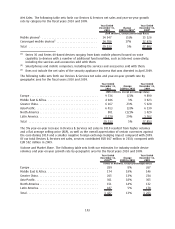
Our mobile device volumes declined 8% in 2009 compared with 2008, to 432 million units. Of those
volumes, our converged mobile device volumes were 67.8 million units in 2009, compared with
60.6 million units in 2008. The yearonyear volume decline in our mobile device volumes was
primarily due to difficult global economic conditions, including weaker consumer and corporate
spending, constrained credit availability and currency market volatility. Based on the industry mobile
device market definition we used in 2009 and 2008, our mobile device volume market share
decreased to 38% in 2009, compared with 39% in 2008. The decrease in our device volume market
share was primarily due to intense competition. In 2009, we estimate that Nokia was the market
leader in Europe, AsiaPacific, China and Latin America. We further estimate that we were also the
market leader in the fastest growing markets of the world, including Middle East & Africa, South East
AsiaPacific and India. We continued to be the market share leader in the entrylevel market with an
estimated market share of approximately 45%. We also continued to be the market share leader in
converged mobile devices. Our estimated converged mobile device market share remained unchanged
at 38% in 2009, compared with 2008, despite strong competition.
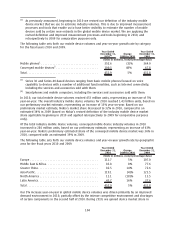
During 2009, based on the industry mobile device market definition we used in 2009, we estimate
that Nokia gained mobile device market share in Europe and Middle East & Africa. Our device market
share decreased in AsiaPacific, Latin America and North America. Our device market share was flat in
Greater China.
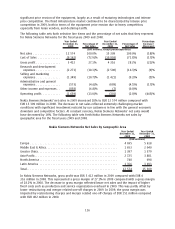
In Europe, we estimate that our market share increased. Nokia’s share increased in, for example,
Germany, the United Kingdom, Russia and Spain, but was partly offset by market share declines in
Italy, Finland, Ireland and some other countries. In Middle East & Africa our market share increased
driven by share gains for instance in Nigeria.
In AsiaPacific, Nokia’s market share declined in 2009 as a result of market share losses in several
markets, including Singapore and Thailand. In Latin America, Nokia’s market share declined in 2009
as a result of market share losses in several markets, including Brazil, Mexico and Argentina. Our
market share declined in North America in 2009 primarily due to a market share decline in the United
States. In Greater China, Nokia continued to benefit from its brand, broad product portfolio and
extensive distribution system during 2009.
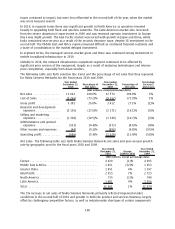
Nokia’s device ASP in 2009 was EUR 63, a decline of 15% from EUR 74 in 2008. Industry ASPs also
declined in 2009. Nokia’s lower ASP in 2009 compared to 2008 was primarily the result of a higher
proportion of lowerpriced entry level device sales as well as general price pressure.
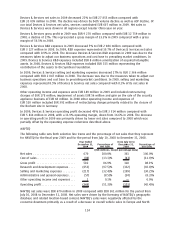
The following table sets forth selective line items and the percentage of net sales that they represent
for the Devices & Services group for the fiscal years 2009 and 2008.
Year Ended
December 31,
2009
Percentage of
Net Sales
Year Ended
December 31,
2008
Percentage of
Net Sales
Percentage
Increase/
(Decrease)
(EUR millions, except percentage data)
Net sales ................. 27853 100.0% 35 099 100.0% (21)%
Cost of sales .............. (18583) (66.7)% (22 360) (63.7)% (17)%
Gross profit ............... 9270 33.3% 12 739 36.3% (27)%
Research and development
expenses ............... (2984) (10.7)% (3 127) (8.9)% (5)%
Selling and marketing
expenses ............... (2366) (8.5)% (2 847) (8.1)% (17)%
Administrative and general
expenses ............... (417) (1.5)% (429) (1.2)% (3)%
Other operating income and
expenses ............... (189) (0.7)% (520) (1.5)% (64)%
Operating profit............ 3314 11.9% 5 816 16.6% (43)%
113