Nokia 2010 Annual Report Download - page 269
Download and view the complete annual report
Please find page 269 of the 2010 Nokia annual report below. You can navigate through the pages in the report by either clicking on the pages listed below, or by using the keyword search tool below to find specific information within the annual report.-
 1
1 -
2
-
3
-
4
-
5
-
6
-
7
-
8
-
9
-
10
-
11
-
12
-
13
-
14
-
15
-
16
-
17
-
18
-
19
-
20
-
21
-
22
-
23
-
24
-
25
-
26
-
27
-
28
-
29
-
30
-
31
-
32
-
33
-
34
-
35
-
36
-
37
-
38
-
39
-
40
-
41
-
42
-
43
-
44
-
45
-
46
-
47
-
48
-
49
-
50
-
51
-
52
-
53
-
54
-
55
-
56
-
57
-
58
-
59
-
60
-
61
-
62
-
63
-
64
-
65
-
66
-
67
-
68
-
69
-
70
-
71
-
72
-
73
-
74
-
75
-
76
-
77
-
78
-
79
-
80
-
81
-
82
-
83
-
84
-
85
-
86
-
87
-
88
-
89
-
90
-
91
-
92
-
93
-
94
-
95
-
96
-
97
-
98
-
99
-
100
-
101
-
102
-
103
-
104
-
105
-
106
-
107
-
108
-
109
-
110
-
111
-
112
-
113
-
114
-
115
-
116
-
117
-
118
-
119
-
120
-
121
-
122
-
123
-
124
-
125
-
126
-
127
-
128
-
129
-
130
-
131
-
132
-
133
-
134
-
135
-
136
-
137
-
138
-
139
-
140
-
141
-
142
-
143
-
144
-
145
-
146
-
147
-
148
-
149
-
150
-
151
-
152
-
153
-
154
-
155
-
156
-
157
-
158
-
159
-
160
-
161
-
162
-
163
-
164
-
165
-
166
-
167
-
168
-
169
-
170
-
171
-
172
-
173
-
174
-
175
-
176
-
177
-
178
-
179
-
180
-
181
-
182
-
183
-
184
-
185
-
186
-
187
-
188
-
189
-
190
-
191
-
192
-
193
-
194
-
195
-
196
-
197
-
198
-
199
-
200
-
201
-
202
-
203
-
204
-
205
-
206
-
207
-
208
-
209
-
210
-
211
-
212
-
213
-
214
-
215
-
216
-
217
-
218
-
219
-
220
-
221
-
222
-
223
-
224
-
225
-
226
-
227
-
228
-
229
-
230
-
231
-
232
-
233
-
234
-
235
-
236
-
237
-
238
-
239
-
240
-
241
-
242
-
243
-
244
-
245
-
246
-
247
-
248
-
249
-
250
-
251
-
252
-
253
-
254
-
255
-
256
-
257
-
258
-
 259
259 -
 260
260 -
 261
261 -
 262
262 -
 263
263 -
 264
264 -
 265
265 -
 266
266 -
 267
267 -
 268
268 -
 269
269 -
 270
270 -
 271
271 -
 272
272 -
 273
273 -
 274
274 -
 275
275
 |
 |

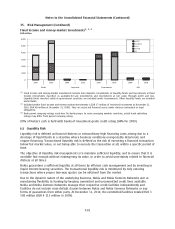
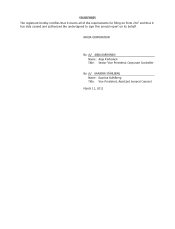
35. Risk Management (Continued)
Fixed income and moneymarket investments
1, 2, 3
EUR million
,0
1,000
2,000
3,000
4,000
5,000
6,000
2009 2010 2009 2010 2009 2010 2009 2010
Banks Corporates Governments ABS
Ba1B3
Baa1Baa3
A1A3
Aa1Aa3
Aaa
(1)
Fixed income and moneymarket investments include term deposits, investments in liquidity funds and investments in fixed
income instruments classified as availableforsale investments and investments at fair value through profit and loss.
Liquidity funds invested solely in government securities are included under Governments. Other liquidity funds are included
under Banks.
(2)
Included within fixed income and moneymarket investments is EUR 37 million of restricted investment at December 31,
2010 (EUR 48 million at December 31, 2009). They are restricted financial assets under various contractual or legal
obligations.
(3)
Bank parent company ratings used here for bank groups. In some emerging markets countries, actual bank subsidiary
ratings may differ from parent company rating.
89% of Nokia’s cash is held with banks of investment grade credit rating (84% for 2009).
(c) Liquidity Risk
Liquidity risk is defined as financial distress or extraordinary high financing costs arising due to a
shortage of liquid funds in a situation where business conditions unexpectedly deteriorate and
require financing. Transactional liquidity risk is defined as the risk of executing a financial transaction
below fair market value, or not being able to execute the transaction at all, within a specific period of
time.
The objective of liquidity risk management is to maintain sufficient liquidity, and to ensure that it is
available fast enough without endangering its value, in order to avoid uncertainty related to financial
distress at all times.
Nokia guarantees a sufficient liquidity at all times by efficient cash management and by investing in
liquid interest bearing securities. The transactional liquidity risk is minimized by only entering
transactions where proper twoway quotes can be obtained from the market.
Due to the dynamic nature of the underlying business, Nokia and Nokia Siemens Networks aim at
maintaining flexibility in funding by keeping committed and uncommitted credit lines available.
Nokia and Nokia Siemens Networks manage their respective credit facilities independently and
facilities do not include crossdefault clauses between Nokia and Nokia Siemens Networks or any
forms of guarantees from either party. At December 31, 2010, the committed facilities totaled EUR 3
508 million (EUR 4 113 million in 2009).
F81
Notes to the Consolidated Financial Statements (Continued)