Nokia 2010 Annual Report Download - page 123
Download and view the complete annual report
Please find page 123 of the 2010 Nokia annual report below. You can navigate through the pages in the report by either clicking on the pages listed below, or by using the keyword search tool below to find specific information within the annual report.-
 1
1 -
2
-
3
-
4
-
5
-
6
-
7
-
8
-
9
-
10
-
11
-
12
-
13
-
14
-
15
-
16
-
17
-
18
-
19
-
20
-
21
-
22
-
23
-
24
-
25
-
26
-
27
-
28
-
29
-
30
-
31
-
32
-
33
-
34
-
35
-
36
-
37
-
38
-
39
-
40
-
41
-
42
-
43
-
44
-
45
-
46
-
47
-
48
-
49
-
50
-
51
-
52
-
53
-
54
-
55
-
56
-
57
-
58
-
59
-
60
-
61
-
62
-
63
-
64
-
65
-
66
-
67
-
68
-
69
-
70
-
71
-
72
-
73
-
74
-
75
-
76
-
77
-
78
-
79
-
80
-
81
-
82
-
83
-
84
-
85
-
86
-
87
-
88
-
89
-
90
-
91
-
92
-
93
-
94
-
95
-
96
-
97
-
98
-
99
-
100
-
101
-
102
-
103
-
104
-
105
-
106
-
107
-
108
-
109
-
110
-
111
-
112
-
 113
113 -
 114
114 -
 115
115 -
 116
116 -
 117
117 -
 118
118 -
 119
119 -
 120
120 -
 121
121 -
 122
122 -
 123
123 -
 124
124 -
 125
125 -
 126
126 -
 127
127 -
 128
128 -
 129
129 -
 130
130 -
 131
131 -
 132
132 -
 133
133 -
134
-
135
-
136
-
137
-
138
-
139
-
140
-
141
-
142
-
143
-
144
-
145
-
146
-
147
-
148
-
149
-
150
-
151
-
152
-
153
-
154
-
155
-
156
-
157
-
158
-
159
-
160
-
161
-
162
-
163
-
164
-
165
-
166
-
167
-
168
-
169
-
170
-
171
-
172
-
173
-
174
-
175
-
176
-
177
-
178
-
179
-
180
-
181
-
182
-
183
-
184
-
185
-
186
-
187
-
188
-
189
-
190
-
191
-
192
-
193
-
194
-
195
-
196
-
197
-
198
-
199
-
200
-
201
-
202
-
203
-
204
-
205
-
206
-
207
-
208
-
209
-
210
-
211
-
212
-
213
-
214
-
215
-
216
-
217
-
218
-
219
-
220
-
221
-
222
-
223
-
224
-
225
-
226
-
227
-
228
-
229
-
230
-
231
-
232
-
233
-
234
-
235
-
236
-
237
-
238
-
239
-
240
-
241
-
242
-
243
-
244
-
245
-
246
-
247
-
248
-
249
-
250
-
251
-
252
-
253
-
254
-
255
-
256
-
257
-
258
-
259
-
260
-
261
-
262
-
263
-
264
-
265
-
266
-
267
-
268
-
269
-
270
-
271
-
272
-
273
-
274
-
275
 |
 |
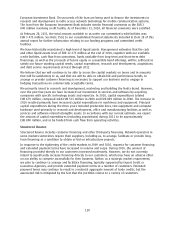
Financial guarantees and securities pledged we may give on behalf of customers represent
guarantees relating to payment by certain Nokia Siemens Networks’ customers and other third
parties under specified loan facilities between such a customer or other third parties and their
creditors. Nokia’s obligations under such guarantees are released upon the earlier of expiration of the
guarantee or early payment by the customer or other third party.
See Note 29 to our consolidated financial statements included in Item 18 of this annual report for
further information regarding commitments and contingencies.
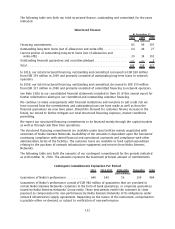
5C. Research and Development, Patents and Licenses
Success in the mobile communications industry requires continuous introduction of new products and
services and their combinations based on the latest available technology. Consequently, we have
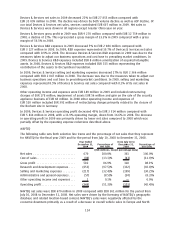
made substantial R&D investments in each of the last three years. Our consolidated R&D expenses for
2010 were EUR 5 863 million, a decrease of 0.8% from EUR 5 909 million in 2009. The decrease in
R&D expenses was primarily due to decreased R&D expenses in Devices & Services and Nokia Siemens
Networks partially offset by an increase in NAVTEQ R&D expenses. R&D expenses in 2008 were
EUR 5 968 million. These expenses represented 13.8%, 14.4% and 11.8% of Nokia net sales in 2010,
2009 and 2008, respectively. In 2010, Devices & Services R&D expenses included EUR 10 million of
purchase price accounting related items compared to EUR 8 million in 2009. In 2008, Devices &
Services R&D expenses included EUR 153 million representing the contribution of the assets to the
Symbian Foundation. In 2010, Nokia Siemens Networks incurred a restructuring charge of
EUR 19 million and EUR 180 million of purchase price accounting related items compared to
EUR 30 million and EUR 180 million in 2009, respectively. In 2008, Nokia Siemens Networks incurred a
restructuring charge of EUR 46 million and EUR 180 million. In 2010, NAVTEQ R&D expenses included
EUR 366 million of purchase price accounting related items compared to EUR 346 million in 2009.
NAVTEQ R&D expenses for the six months ended December 2008 included EUR 171 million of purchase
price accounting related items.
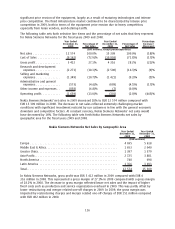
At December 31, 2010, we employed 35 869 people in R&D, representing approximately 27% of our
total workforce, and had a strong research and development presence in 16 countries. R&D expenses
of Devices & Services as a percentage of its net sales were 10.1% in 2010 compared with 10.7% in
2009 and 8.9% in 2008. NAVTEQ R&D expenses represented 75.0% of its net sales in 2010, compared
with 97.5% of its net sales in 2009 and 92.0% for the six months ended December 31, 2008. In the
case of Nokia Siemens Networks, R&D expenses represented 17.0%, 18.1% and 16.3% of its net sales
in 2010, 2009 and 2008, respectively.
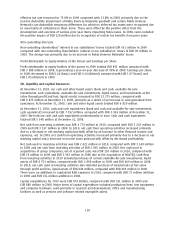
We will continue to invest in R&D in an appropriate manner to support our new strategic objectives.
For example, the proposed Microsoft partnership should enable us to make more focused R&D
investments in platforms and services. This is expected to result in lower overall R&D expenses over
the longer term in our devices and services business.
5D. Trends Information
See Item 5.A “Operating Results—Principal Factors and Trends Affecting our Results of Operations” for
information on material trends affecting our business and results of operations.
5E. OffBalance Sheet Arrangements
There are no material offbalance sheet arrangements that have or are reasonably likely to have a
current or future effect on our financial condition, changes in financial condition, revenues or
expenses, results of operations, liquidity, capital expenditures or capital resources that is material to
investors.
122