Nokia 2010 Annual Report Download - page 105
Download and view the complete annual report
Please find page 105 of the 2010 Nokia annual report below. You can navigate through the pages in the report by either clicking on the pages listed below, or by using the keyword search tool below to find specific information within the annual report.-
 1
1 -
2
-
3
-
4
-
5
-
6
-
7
-
8
-
9
-
10
-
11
-
12
-
13
-
14
-
15
-
16
-
17
-
18
-
19
-
20
-
21
-
22
-
23
-
24
-
25
-
26
-
27
-
28
-
29
-
30
-
31
-
32
-
33
-
34
-
35
-
36
-
37
-
38
-
39
-
40
-
41
-
42
-
43
-
44
-
45
-
46
-
47
-
48
-
49
-
50
-
51
-
52
-
53
-
54
-
55
-
56
-
57
-
58
-
59
-
60
-
61
-
62
-
63
-
64
-
65
-
66
-
67
-
68
-
69
-
70
-
71
-
72
-
73
-
74
-
75
-
76
-
77
-
78
-
79
-
80
-
81
-
82
-
83
-
84
-
85
-
86
-
87
-
88
-
89
-
90
-
91
-
92
-
93
-
94
-
 95
95 -
 96
96 -
 97
97 -
 98
98 -
 99
99 -
 100
100 -
 101
101 -
 102
102 -
 103
103 -
 104
104 -
 105
105 -
 106
106 -
 107
107 -
 108
108 -
 109
109 -
 110
110 -
 111
111 -
 112
112 -
 113
113 -
 114
114 -
 115
115 -
116
-
117
-
118
-
119
-
120
-
121
-
122
-
123
-
124
-
125
-
126
-
127
-
128
-
129
-
130
-
131
-
132
-
133
-
134
-
135
-
136
-
137
-
138
-
139
-
140
-
141
-
142
-
143
-
144
-
145
-
146
-
147
-
148
-
149
-
150
-
151
-
152
-
153
-
154
-
155
-
156
-
157
-
158
-
159
-
160
-
161
-
162
-
163
-
164
-
165
-
166
-
167
-
168
-
169
-
170
-
171
-
172
-
173
-
174
-
175
-
176
-
177
-
178
-
179
-
180
-
181
-
182
-
183
-
184
-
185
-
186
-
187
-
188
-
189
-
190
-
191
-
192
-
193
-
194
-
195
-
196
-
197
-
198
-
199
-
200
-
201
-
202
-
203
-
204
-
205
-
206
-
207
-
208
-
209
-
210
-
211
-
212
-
213
-
214
-
215
-
216
-
217
-
218
-
219
-
220
-
221
-
222
-
223
-
224
-
225
-
226
-
227
-
228
-
229
-
230
-
231
-
232
-
233
-
234
-
235
-
236
-
237
-
238
-
239
-
240
-
241
-
242
-
243
-
244
-
245
-
246
-
247
-
248
-
249
-
250
-
251
-
252
-
253
-
254
-
255
-
256
-
257
-
258
-
259
-
260
-
261
-
262
-
263
-
264
-
265
-
266
-
267
-
268
-
269
-
270
-
271
-
272
-
273
-
274
-
275
 |
 |

(1)
As previously announced, beginning in 2010 we revised our definition of the industry mobile
device market that we use to estimate industry volumes. This is due to improved measurement
processes and tools that enable us to have better visibility to estimate the number of mobile
devices sold by certain new entrants in the global mobile device market. We are applying the
revised definition and improved measurement processes and tools beginning in 2010, and
retrospectively to 2009 for comparative purposes only.
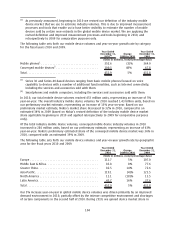
The following table sets forth our mobile device volumes and yearonyear growth rate by category
for the fiscal years 2010 and 2009.
Year Ended
December 31,
2010
(1)
Change
2009 to 2010
Year Ended
December 31,
2009
(Units in millions, except percentage data)
Mobile phones
1
................................... 352.6 (3)% 364.0
Converged mobile devices
2
.......................... 100.3 48% 67.8
Total ............................................ 452.9 5% 431.8
(1)
Series 30 and Series 40based devices ranging from basic mobile phones focused on voice
capability to devices with a number of additional functionalities, such as Internet connectivity,
including the services and accessories sold with them.
(2)
Smartphones and mobile computers, including the services and accessories sold with them.
In 2010, our total mobile device volumes reached 453 million units, representing an increase of 5%
yearonyear. The overall industry mobile device volumes for 2010 reached 1.43 billion units, based on
our preliminary market estimate, representing an increase of 13% yearonyear. Based on our
preliminary market estimate, Nokia’s market share decreased to 32% in 2010, compared to an
estimated 34% in 2009 (based on Nokia’s revised definition of the industry mobile device market
share applicable beginning in 2010 and applied retrospectively to 2009 for comparative purposes
only).
Of the total industry mobile device volumes, converged mobile device industry volumes in 2010
increased to 286 million units, based on our preliminary estimate, representing an increase of 63%
yearonyear. Nokia’s preliminary estimated share of the converged mobile device market was 36% in
2010, compared with an estimated 39% in 2009.
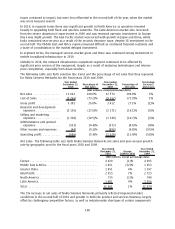
The following table sets forth our mobile device volumes and yearonyear growth rate by geographic
area for the fiscal years 2010 and 2009.
Year Ended
December 31,
2010
Change
2009 to 2010
Year Ended
December 31,
2009
(Units in millions, except percentage data)
Europe .......................................... 112.7 5% 107.0
Middle East & Africa ................................ 83.8 8% 77.6
Greater China ..................................... 82.5 14% 72.6
AsiaPacific. . ..................................... 119.1 (4)% 123.5
North America .................................... 11.1 (18)% 13.5
Latin America..................................... 43.7 16% 37.6
Total ............................................ 452.9 5% 431.8
Our 5% increase yearonyear in global mobile device volumes was driven primarily by an improved
demand environment in 2010, partially offset by the intense competitive environment and shortages
of certain components in the second half of 2010. During 2010, we gained device market share in
104