Nokia 2010 Annual Report Download - page 196
Download and view the complete annual report
Please find page 196 of the 2010 Nokia annual report below. You can navigate through the pages in the report by either clicking on the pages listed below, or by using the keyword search tool below to find specific information within the annual report.-
 1
1 -
2
-
3
-
4
-
5
-
6
-
7
-
8
-
9
-
10
-
11
-
12
-
13
-
14
-
15
-
16
-
17
-
18
-
19
-
20
-
21
-
22
-
23
-
24
-
25
-
26
-
27
-
28
-
29
-
30
-
31
-
32
-
33
-
34
-
35
-
36
-
37
-
38
-
39
-
40
-
41
-
42
-
43
-
44
-
45
-
46
-
47
-
48
-
49
-
50
-
51
-
52
-
53
-
54
-
55
-
56
-
57
-
58
-
59
-
60
-
61
-
62
-
63
-
64
-
65
-
66
-
67
-
68
-
69
-
70
-
71
-
72
-
73
-
74
-
75
-
76
-
77
-
78
-
79
-
80
-
81
-
82
-
83
-
84
-
85
-
86
-
87
-
88
-
89
-
90
-
91
-
92
-
93
-
94
-
95
-
96
-
97
-
98
-
99
-
100
-
101
-
102
-
103
-
104
-
105
-
106
-
107
-
108
-
109
-
110
-
111
-
112
-
113
-
114
-
115
-
116
-
117
-
118
-
119
-
120
-
121
-
122
-
123
-
124
-
125
-
126
-
127
-
128
-
129
-
130
-
131
-
132
-
133
-
134
-
135
-
136
-
137
-
138
-
139
-
140
-
141
-
142
-
143
-
144
-
145
-
146
-
147
-
148
-
149
-
150
-
151
-
152
-
153
-
154
-
155
-
156
-
157
-
158
-
159
-
160
-
161
-
162
-
163
-
164
-
165
-
166
-
167
-
168
-
169
-
170
-
171
-
172
-
173
-
174
-
175
-
176
-
177
-
178
-
179
-
180
-
181
-
182
-
183
-
184
-
185
-
 186
186 -
 187
187 -
 188
188 -
 189
189 -
 190
190 -
 191
191 -
 192
192 -
 193
193 -
 194
194 -
 195
195 -
 196
196 -
 197
197 -
 198
198 -
 199
199 -
 200
200 -
 201
201 -
 202
202 -
 203
203 -
 204
204 -
 205
205 -
 206
206 -
207
-
208
-
209
-
210
-
211
-
212
-
213
-
214
-
215
-
216
-
217
-
218
-
219
-
220
-
221
-
222
-
223
-
224
-
225
-
226
-
227
-
228
-
229
-
230
-
231
-
232
-
233
-
234
-
235
-
236
-
237
-
238
-
239
-
240
-
241
-
242
-
243
-
244
-
245
-
246
-
247
-
248
-
249
-
250
-
251
-
252
-
253
-
254
-
255
-
256
-
257
-
258
-
259
-
260
-
261
-
262
-
263
-
264
-
265
-
266
-
267
-
268
-
269
-
270
-
271
-
272
-
273
-
274
-
275
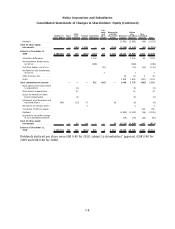
 |
 |

Number of
shares (000’s)
Share
capital
Share
issue
premium
Treasury
shares
Translation
differences
Fair
value
and
other
reserves
Reserve for
invested
nonrestrict.
equity
Retained
earnings
Before
non
controlling
interests
Non
controlling
interests Total
Dividend ............... (1 481) (1 481) (44) (1 525)
Total of other equity
movements ............. — (163) 1 200 — — (136) (2 450) (1 549) (45) (1 594)
Balance at December 31,
2009 .................. 3 708 262 246 279 (681) (127) 69 3 170 10 132 13 088 1 661 14 749
Translation differences ...... 1240 1240 64 1304
Net investment hedge losses,
netoftax ............. (288) (288) (288)
Cash flow hedges, net of tax . . . (73) (73) (43) (116)
Availableforsale investments,
netoftax ............. 7 7 7
Other increase, net . . . ...... 40 40 5 45
Profit. . . ............... 1 850 1 850 (507) 1 343
Total comprehensive income .. — — — 952 (66) — 1 890 2 776 (481) 2 295
Stock options exercised related
to acquisitions .......... (1) (1) (1)
Sharebased compensation . . . . 47 47 47
Excess tax benefit on share
based compensation ...... (1) (1) (1)
Settlement of performance and
restricted shares . . . ...... 868 (12) 17 (9) (4) (4)
Reissuance of treasury shares . . 1 1 1
Conversion of debt to equity. . . 766 766
Dividend ............... (1 483) (1 483) (56) (1 539)
Acquisitions and other change
in noncontrolling interests . . (39) (39) (43) (82)
Total of other equity
movements ............. — 33 18 — — (9) (1 522) (1 480) 667 (813)
Balance at December 31,
2010 .................. 3 709 130 246 312 (663) 825 3 3 161 10 500 14 384 1 847 16 231
Dividends declared per share were EUR 0.40 for 2010, subject to shareholders’ approval, (EUR 0.40 for
2009 and EUR 0.40 for 2008).
F8
Nokia Corporation and Subsidiaries
Consolidated Statements of Changes in Shareholders’ Equity (Continued)