Nokia 2010 Annual Report Download - page 213
Download and view the complete annual report
Please find page 213 of the 2010 Nokia annual report below. You can navigate through the pages in the report by either clicking on the pages listed below, or by using the keyword search tool below to find specific information within the annual report.-
 1
1 -
2
-
3
-
4
-
5
-
6
-
7
-
8
-
9
-
10
-
11
-
12
-
13
-
14
-
15
-
16
-
17
-
18
-
19
-
20
-
21
-
22
-
23
-
24
-
25
-
26
-
27
-
28
-
29
-
30
-
31
-
32
-
33
-
34
-
35
-
36
-
37
-
38
-
39
-
40
-
41
-
42
-
43
-
44
-
45
-
46
-
47
-
48
-
49
-
50
-
51
-
52
-
53
-
54
-
55
-
56
-
57
-
58
-
59
-
60
-
61
-
62
-
63
-
64
-
65
-
66
-
67
-
68
-
69
-
70
-
71
-
72
-
73
-
74
-
75
-
76
-
77
-
78
-
79
-
80
-
81
-
82
-
83
-
84
-
85
-
86
-
87
-
88
-
89
-
90
-
91
-
92
-
93
-
94
-
95
-
96
-
97
-
98
-
99
-
100
-
101
-
102
-
103
-
104
-
105
-
106
-
107
-
108
-
109
-
110
-
111
-
112
-
113
-
114
-
115
-
116
-
117
-
118
-
119
-
120
-
121
-
122
-
123
-
124
-
125
-
126
-
127
-
128
-
129
-
130
-
131
-
132
-
133
-
134
-
135
-
136
-
137
-
138
-
139
-
140
-
141
-
142
-
143
-
144
-
145
-
146
-
147
-
148
-
149
-
150
-
151
-
152
-
153
-
154
-
155
-
156
-
157
-
158
-
159
-
160
-
161
-
162
-
163
-
164
-
165
-
166
-
167
-
168
-
169
-
170
-
171
-
172
-
173
-
174
-
175
-
176
-
177
-
178
-
179
-
180
-
181
-
182
-
183
-
184
-
185
-
186
-
187
-
188
-
189
-
190
-
191
-
192
-
193
-
194
-
195
-
196
-
197
-
198
-
199
-
200
-
201
-
202
-
 203
203 -
 204
204 -
 205
205 -
 206
206 -
 207
207 -
 208
208 -
 209
209 -
 210
210 -
 211
211 -
 212
212 -
 213
213 -
 214
214 -
 215
215 -
 216
216 -
 217
217 -
 218
218 -
 219
219 -
 220
220 -
 221
221 -
 222
222 -
 223
223 -
224
-
225
-
226
-
227
-
228
-
229
-
230
-
231
-
232
-
233
-
234
-
235
-
236
-
237
-
238
-
239
-
240
-
241
-
242
-
243
-
244
-
245
-
246
-
247
-
248
-
249
-
250
-
251
-
252
-
253
-
254
-
255
-
256
-
257
-
258
-
259
-
260
-
261
-
262
-
263
-
264
-
265
-
266
-
267
-
268
-
269
-
270
-
271
-
272
-
273
-
274
-
275
 |
 |

2. Segment information (Continued)
Nokia Siemens Networks provides mobile and fixed network solutions and services to operators and
service providers.
Corporate Common Functions consists of company wide functions.
The accounting policies of the segments are the same as those described in Note 1. Nokia accounts
for intersegment revenues and transfers as if the revenues or transfers were to third parties, that is,
at current market prices. Nokia evaluates the performance of its segments and allocates resources to
them based on operating profit.
No single customer represents 10% or more of Group revenues.
2010
Devices &
Services NAVTEQ
Nokia
Siemens
Networks
Total
reportable
segments
Corporate
Common
Functions and
Corporate
unallocated
(4),(6)
Eliminations Group
EURm EURm EURm EURm EURm EURm EURm
Profit and Loss Information
Net sales to external customers ..... 29118 668 12660 42446 — 42446
Net sales to other segments ........ 16 334 1 351 — (351) —
Depreciation and amortization ...... 405 519 843 1767 4 1771
Impairment ................... — — 2 2 13 15
Operating profit / (loss) ........... 3299 (225) (686) 2 388 (114) (204)
(7)
2 070
Share of results of associated
companies................. — 2 11 13 (12) 1
Balance Sheet Information
Capital expenditures
(2)
............ 337 36 306 679 — 679
Segment assets
(3)
............... 9560 6492 10621 26673 14998 (2548) 39 123
of which:
Investments in associated
companies................. — 7 42 49 87 136
Segment liabilities
(5)
............. 10146 2488 7190 19824 5616 (2548) 22892
2009
Devices &
Services NAVTEQ
Nokia
Siemens
Networks
Total
reportable
segments
Corporate
Common
Functions and
Corporate
unallocated
(4),(6)
Eliminations Group
EURm EURm EURm EURm EURm EURm EURm
Profit and Loss Information
Net sales to external customers ..... 27841 579 12564 40984 — 40984
Net sales to other segments ........ 12 91 10 113 — (113) —
Depreciation and amortization ...... 432 488 860 1780 4 1784
Impairment ................... 56 — 919 975 34 1009
Operating profit / (loss)
(1)
......... 3314 (344) (1639) 1331 (134) 1 197
Share of results of associated
companies .................. — — 32 32 (2) 30
Balance Sheet Information
Capital expenditures
(2)
............ 232 21 278 531 — 531
Segment assets
(3)
............... 9203 6145 11015 26363 12479 (3104) 35 738
of which:
Investments in associated
companies................. — 5 26 31 38 69
Segment liabilities
(5)
............. 8268 2330 7927 18525 5568 (3104) 20 989
F25
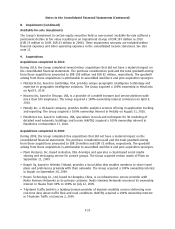
Notes to the Consolidated Financial Statements (Continued)